|
Key Research Questions |
|
|
Underlying Metrics |
On-Time Credit Accumulation Rate: The percentage of students earning sufficient credits toward on-time completion in their first year (30 credits for full-time and 15 credits for part-time). Gateway Course Completion Rate: The percentage of students completing college-level introductory math and English courses, tracked separately, in their first year. Retention rate: The percentage of students in a cohort who are either enrolled at their initial institution or transfer to a longer program at the initial or subsequent institution, calculated annually up to 200% of program length. Persistence rate: The percentage of students in a cohort remaining enrolled or earning a credential at their initial or subsequent institution, measured annually up to 200% of program length. |
|
Disaggregates |
First tier: academic preparation, race/ethnicity, economic status, gender Second tier: receipt of Title IV aid, unmet need, STEM program enrollment, age, race by gender, gender by STEM |
| For more detail on these underlying metrics, refer to pages 3.3 - 3.9 in the Metrics Framework. | |
While the two most important milestones for any student in higher education are entering college and graduating with a degree, progression represents nearly every essential step in between. How students and institutions perform during the progression phase of the pipeline has enormous implications for both college completion and college affordability. Students’ failure to complete represents lost opportunity and sunk costs for each student and the institution.12 Furthermore, failure to adequately progress in college can result in devastating financial outcomes. This is especially true if the students have taken on debt to pay college costs—a trend that particularly impacts low-income students and students of color.3 Student borrowers who drop out of college are over five times more likely to default on student loans than borrowers who finish a bachelor’s degree.4 Furthermore, even if students do not drop out, inadequate credit accumulation often results in delayed completion. Each additional year a student spends in college represents lost earnings and increased costs for the student, as well as expenses for the institution.5
In order to move students from enrollment to completion, it is imperative that institutions understand who is successfully moving through the academic pipeline and hitting the key milestones that research has shown to be leading indicators of degree completion. These indicators include credit accumulation, gateway course completion, and high credit completion ratios.67 One study illustrates that due to academic momentum, full-time students who complete 15 credits in their first semester (30 in the first year) are a massive 19 percentage points more likely to complete their four-year degree than those students who take only one course less (12 credits per semester).8
Sidebox 2.1: Using Financial Aid Requirements to Incentivize Higher Enrollment Intensity Can Be Damaging
While the evidence is clear that higher credit intensity generally improves graduation rates, reduces the time to degree, and increases college affordability, some states and institutions (see: the Minnesota State Grant9 or Indiana’s Financial Aid system10) have made completing 15 credits per semester mandatory for complete financial aid packages. These programs reduce or entirely remove financial aid packages for students who take fewer courses. Unfortunately, using financial aid as a performance-based incentive can be more harmful than helpful—especially to low-income students. These students, in particular, are facing greater financial challenges and are likely to work more hours off campus, which can, in turn, make taking a full 15 credit hours per semester unsustainable. This can result in a financial catch-22: unable to manage a full course load for the much-needed grant aid, and unable to work the necessary paid hours, the student is forced into attending college part-time or dropping out. There is also some evidence that performance-based incentives encourage students to take easier courses in order to manage their workload and to make sure their academic performance remains satisfactory.11 While we encourage 15 credits per semester as a key metric for measurement, institutions should be careful not to punish students who do not meet the threshold and should do everything they can to remove barriers in the way of students trying to meet this goal.
While the quantity of credit hours attempted is important, which courses a student takes can have meaningful effects on progression as well. Students who do not take and pass a foundational gateway course in their first semester are approximately 1.7 times less likely to persist to a second semester than those who successfully pass one.12 Furthermore, a high credit success rate is indicative of better academic performance, which is extensively correlated with persistence. A student with a GPA of 3.0 after their first semester is 127 times more likely to reenroll for their second semester than a student with a 2.0 GPA.1314 Nearly all states have implemented some type of attainment goal, and institutions play an essential role in reaching these goals.15 However, institutions should be careful to look at data with a student-centered mindset. The positive outcomes correlated with these progression metrics are impressive, but institutions should not simply see great patterns and attempt to force students into higher credit intensities just to meet attainment goals. Instead, institutions can best serve students by digging below the surface to understand and address the progression barriers students face. For instance, some institutions have diagnosed barriers to low credit accumulation rates and then addressed those barriers by improving availability of the required courses that are in high demand, implementing degree maps, and instituting academic supports in the courses from which students drop, withdraw, or fail at high rates.1617 Other institutions have provided additional financial supports to students so they can increase course loads and take summer courses.18 Understanding and addressing barriers can have enormous implications for equity by helping to close persistent completion gaps impacting low-income students and students of color.1920 In order to plug the leaks in their pipeline and help students from all backgrounds attain their degree, institutions should ask several key questions to inform their interventions:
- Which students are meeting key progression benchmarks (see table below), and which students are not? Why?
- What are the outcomes (in terms of retention, time-to-degree, and completion rate) of students who do and do not meet key progression benchmarks each year?
Table 2.1: Definitions and Benchmarks for Progression Metrics
| Metric | Definition & Recommended Benchmark |
|---|---|
|
Credit Accumulation Rate |
|
|
Credit Completion Ratio |
|
|
Gateway Course Completion Rate |
|
|
Retention Rate |
|
| For more detail on these underlying metrics, refer to pages 3.3 - 3.9 in the Metrics Framework. | |
To effectively answer these questions, institutions should collect data for each of these metrics and then disaggregate and analyze the results.
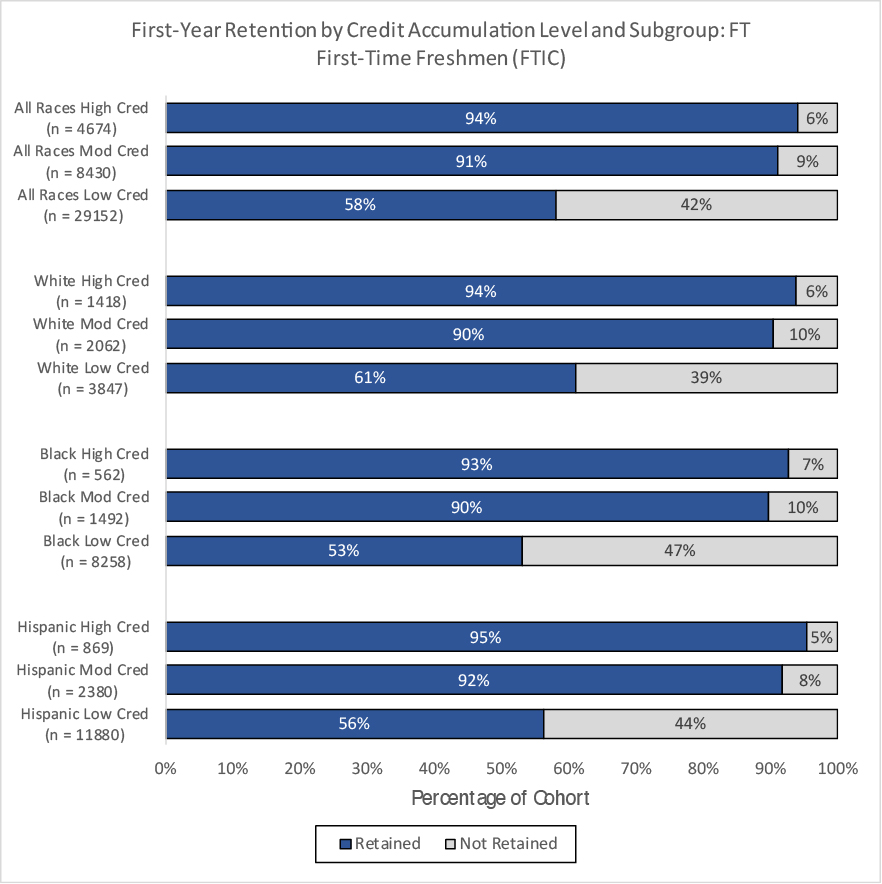
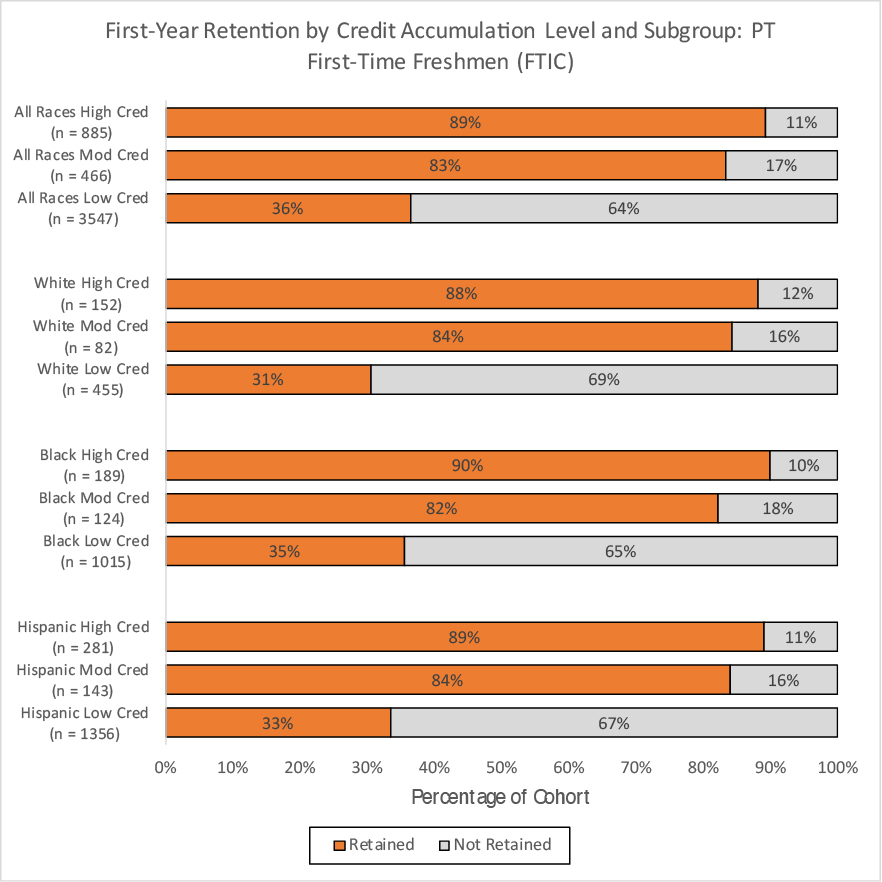
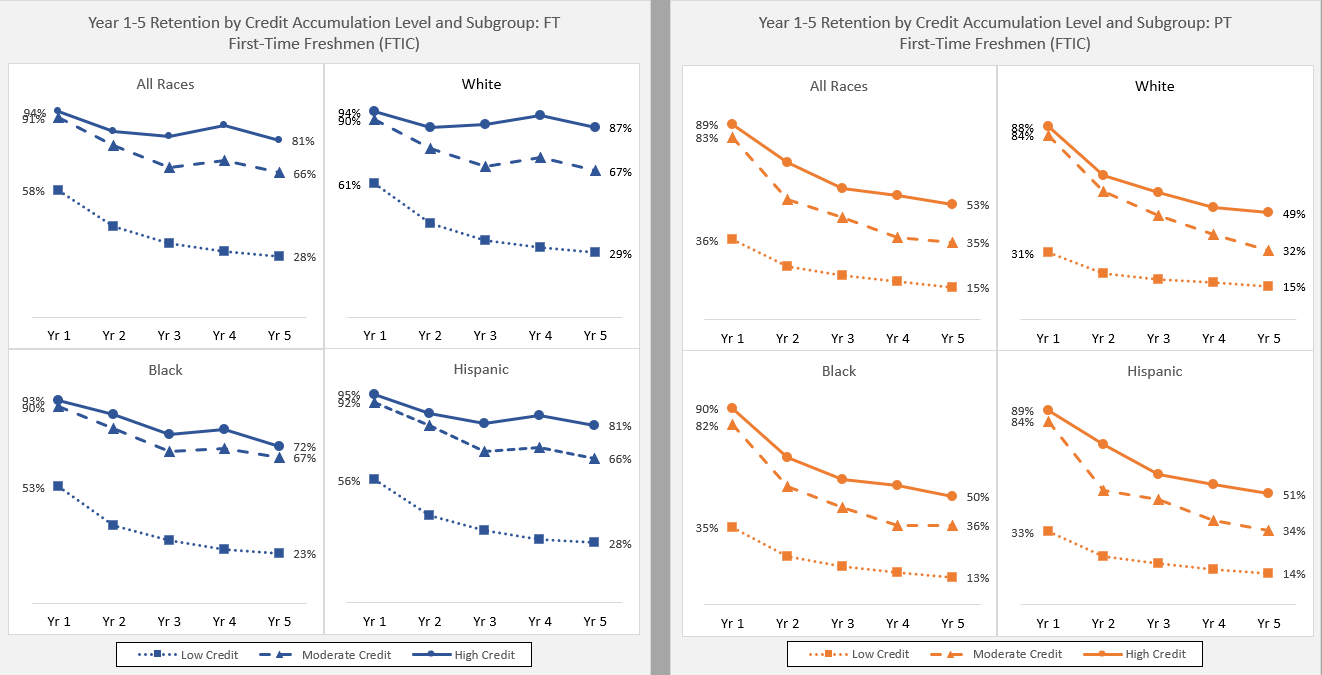
For example, an institution should investigate how credit load relates to retention by race and ethnicity. The analysis below illustrates retention rates by credit accumulation and enrollment status, disaggregated by select racial and ethnic groups. From this analysis, it is evident that all groups, whether enrolled part-time or full-time, are much more likely to return for a second year if they have achieved moderate credit accumulation (above 24 credit hours for full-time students, and above 12 credit hours for part-time students in an academic year), and that all students see an additional boost in retention when students earn 30 credits (for full-time students) or 15 credits (for part-time students) in their first academic year. For instance, among first-time, part-time Latinx students, nearly 90 percent of students who met the 15-credit hour threshold, and 84 percent of students who met the 12-credit hour threshold persisted into the next academic year. In contrast, less than 40 percent of students who did not meet the threshold persisted—an over 50 percentage point gap. However, fewer than a quarter of part-time Latinx students are taking 12 or more credits, suggesting that if the institution intends to increase retention among Latinx students, it should consider strategies to help students take—and pass—heavier course loads.
Figure 2.1: Retention by Credit Accumulation, Race/Ethnicity, and Enrollment Status (First-Time Freshmen)
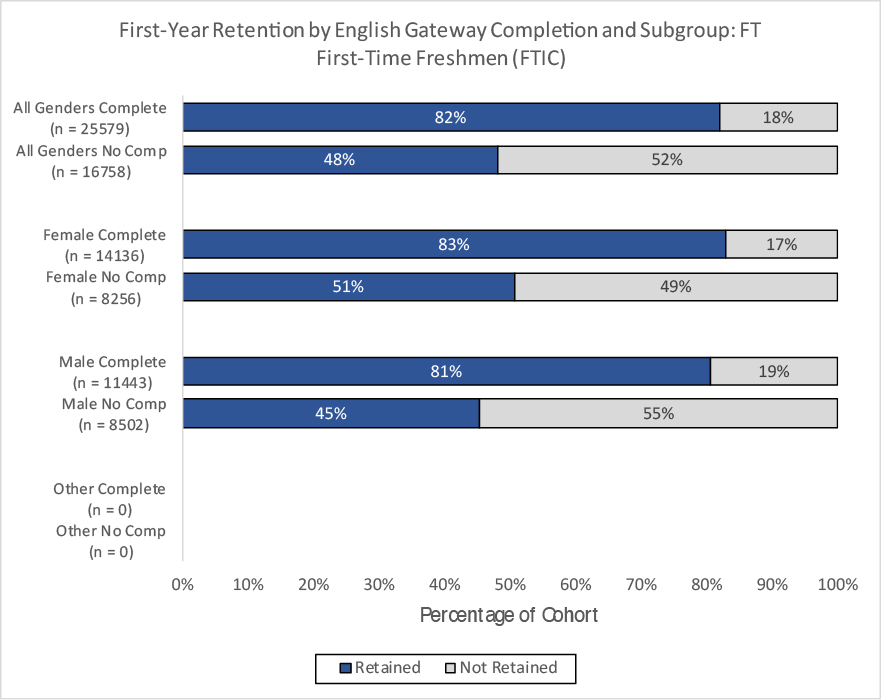
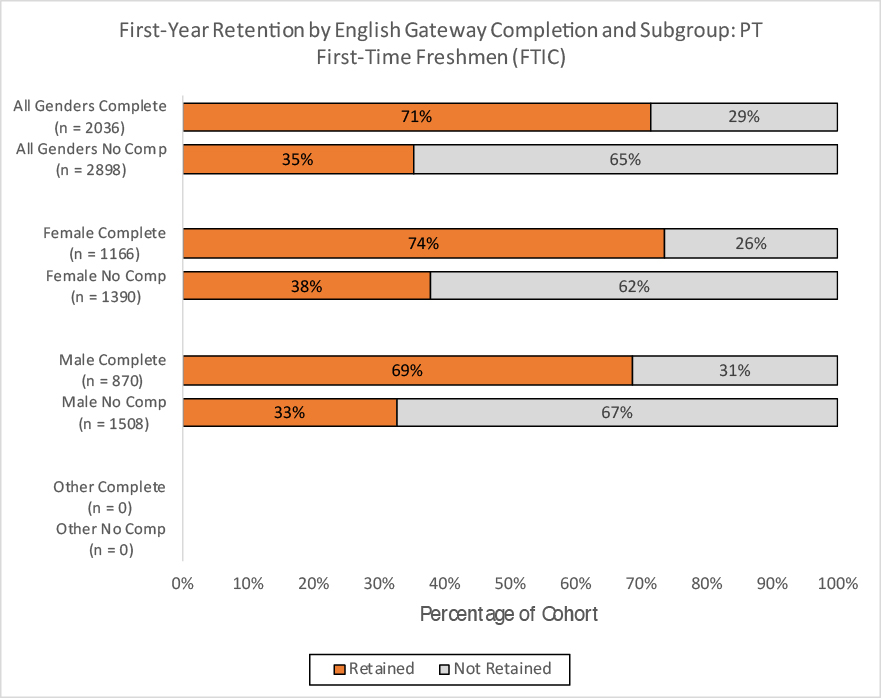
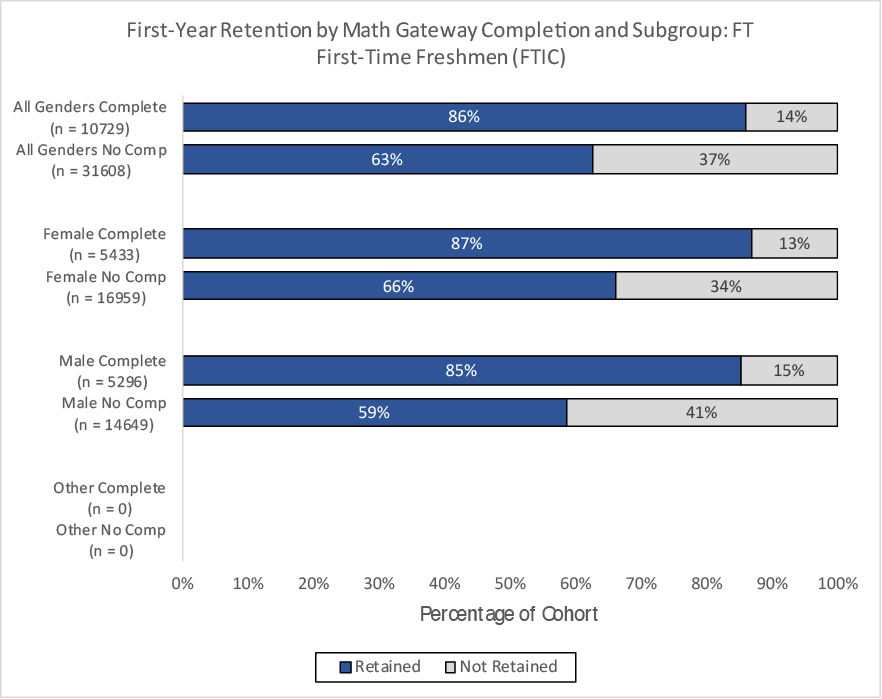
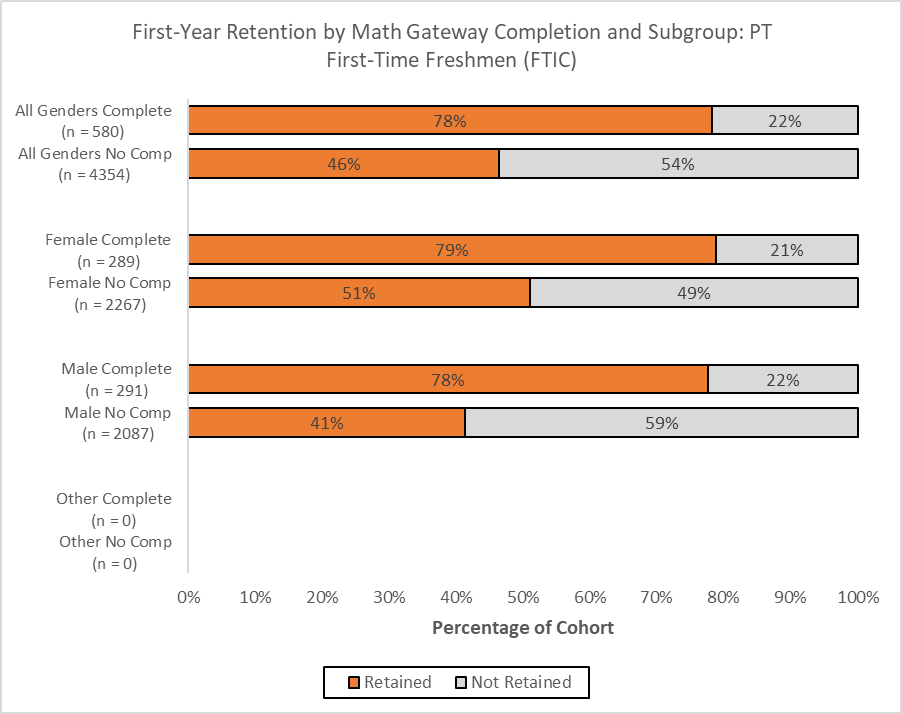
Gateway course completion also has a notable impact on retention. The analysis below (Figure 2.2) indicates that first-time students who complete gateway courses in math or English are more likely to persist than students who do not complete them.
Figure 2.2: Retention by Gateway Course Completion, Gender, and Enrollment Status (First-Time Freshmen)
Beyond first-year retention snapshots, measuring progression requires longitudinal analysis into a cohort’s second, third, fourth, fifth, or sixth year. Looking at the over-time perspective allows for a better understanding of when students are most likely to drop out of the pipeline. Figure 2.3 shows the percentage of students retained each year, combined with those who completed their degrees, including in years five and six (for bachelor’s degree seekers), disaggregated by race, credit accumulation, and English gateway course completion. First, these charts illustrate that the positive effects of higher credit accumulation and gateway course completion remain present over time. The gaps in retention between those who met these benchmarks and those who did not are persistent, reinforcing the value of reaching these milestones. Secondly, these charts show that the greatest drop-off of students occurs between the second and the third year, but a significant drop in retention occurs after the fifth year, regardless of credit accumulation or gateway completion. Institutions might want to consider what factors may be driving the timing of these drop offs.
More important, however, are some of the gaps that these charts can illustrate and the equity implications they hold. Overall, these graphics show lower credit accumulation has a multiplicative, negative effect over time, with widening gaps in persistence between students who complete 30 hours compared to those who complete reduced credit levels. These gaps are especially pronounced among White and Hispanic students (although still meaningful for Black students), suggesting that maintaining a 30-hour course load is beneficial and impactful for all students.
Figure 2.3: Years 2-6 Retention by Credit Accumulation and English Gateway Course Completion
Colin illustrates how an institution like CUNY can see these same results and put solutions into practice. He explains, “In the past six months, we’ve done a lot of work on credit momentum, finding supporting evidence that taking as many credits as you possibly can—as early in your college career as you can—actually leads to better academic momentum and graduating faster.” He continues, “That's led to major credit momentum campaigns, like advertising campaigns, on most of our campuses.”21 Indeed, in February 2018, CUNY publicly launched the Academic Momentum Campaign, with advertisements around campuses to remind students, “the longer you stay, the more you pay.”22 While the program is in its infancy and effectiveness has not been measured, CUNY institutions may start seeing results in the coming years.
Data is often used to inform new interventions (like the Academic Momentum Campaign) for students, but on occasion, good data use can save institutions resources on programs they thought were helping students to progress but actually were ineffective. Colin elaborates:
We are in the midst of large-scale reform that was prompted by a series of analyses that showed that the placement exams that we were using had no predictive value on later college performance. So, we are spending a lot of money on placement exams that don't actually tell us anything.23
This example illustrates that good data use can reduce wasteful spending, and only a careful analysis of progression metrics can ensure that particular processes and interventions are useful at your institution.
- Schneider, M., & Yin, L.M. (2011), The high cost of low graduation rates: How much does dropping out of college really cost? Retrieved from the American Institutes for Research website: https://www.air.org/resource/high-cost-low-graduation-rates. ⏎
- Johnson, N. (2012), The institutional costs of student attrition. Retrieved from the Education Resources Information Center website: https://eric.ed.gov/?id=ED536126. ⏎
- IHEP analysis of 2015-2016 data from the National Postsecondary Student Aid Study (NPSAS:16) a product of the National Center for Education Statistics, U.S. Department of Education. Computation by NCES PowerStats Version 1.0 on May 13, 2019. Variables: FEDPACK, RACE, and TOTLOAN. Weight: WTA000. ⏎
- Miller, B. (2017), New federal data show a student loan crisis for African American borrowers. Retrieved from the Center for American Progress website: https://www.americanprogress.org/issues/education-postsecondary/news/2017/10/16/440711/new-federal-data-show-student-loan-crisis-african-american-borrowers/</a>. ⏎
- Dannenberg, M. & Mugglestone, K. (2017), Making promises: Designing college promise plans worth keeping. Retrieved from the Education Reform Now website: https://edreformnow.org/wp-content/uploads/2017/11/ERN-Making-Promises-Final.pdf. ⏎
- Offenstein, J. Moore C., & Shulock, N. (2010), Advancing by degrees: A framework for increasing college completion. Retrieved from The Education Trust website: https://edtrust.org/wp-content/uploads/2013/10/AdvbyDegrees_0.pdf. ⏎
- Moore, C. & Shulock, N. (2009), Student progress toward degree completion: Lessons from the research literature. Retrieved from the California State University website: https://www.csuchico.edu/gradinitiative/_assets/documents/ihelp-student-progress-toward-degree-completion.pdf. ⏎
- Belfield, C., Jenkins, D., & Lahr, H. (2016). Momentum: The academic and economic value of a 15-credit first-semester course load for college students in tennessee. Retrieved from the Community College Research Center’s website: https://ccrc.tc.columbia.edu/publications/momentum-15-credit-course-load.html. ⏎
- Minnesota Office of Higher Education. (2017), Minnesota State Grant. Retrieved from the Office of Higher Education for the State of Minnesota’s website: https://www.ohe.state.mn.us/mPg.cfm?pageID=138. ⏎
- Indiana Commission for Higher Education. (2015), Reforming student financial aid to increase college completion. Retrieved from the Indiana Commission for Higher Education’s website: https://www.in.gov/che/files/2015_Indiana_Financial_Aid_Reform_13015_Pages.pdf ⏎
- Kinsley, P. & Goldrick-Rab, S. (2015), Making the grade: The academic side of college life among financial aid recipients. Retrieved from the Wisconsin HOPE Lab’s website: https://hope4college.com/wp-content/uploads/2018/09/Kinsley_and_Goldrick-Rab_Making_the_Grade.pdf. ⏎
- Flanders, G. (2017), The effect of gateway course completion on freshman college student retention. Journal of College Student Retention: Research, Theory & Practice. Vol. 19(1). 2-24. Retrieved from: https://journals.sagepub.com/doi/pdf/10.1177/1521025115611396. ⏎
- Ibid. ⏎
- Pascarella, E.T. & Terenzini, P.T. (1991), How college affects students. San Francisco, CA: Jossey-Bass. ⏎
- Strategy Labs. (2016), States with higher education attainment goals. Retrieved from the Lumina Foundation’s website: http://strategylabs.luminafoundation.org/wp-content/uploads/2013/10/State-Attainment-Goals.pdf. ⏎
- The Education Trust. (2013), Replenishing opportunity in America: Florida State University. Retrieved from The Education Trust’s website: http://edtrust.org/wp-content/uploads/2013/10/2012_A2S_Case_Study_Florida_FINAL.pdf. ⏎
- The Education Trust. (2013), Replenishing opportunity in America: University of Wisconsin. Retrieved from The Education Trust’s website: http://edtrust.org/wp-content/uploads/2013/10/2012_A2S_Case_Study_Wisconsin_FINAL.pdf. ⏎
- Sacramento State Financial Aid Office. (2019). Pledge to take 15. Retrieved from the Sacramento State University website at: https://www.csus.edu/excellence/take15/. ⏎
- Whistle, W. & Hiler, T. (2018), The Pell divide: How four-year institutions are failing to graduate low- and moderate-income students. Retrieved from the Third Way’s website: http://thirdway.imgix.net/pdfs/the-pell-divide-how-four-year-institutions-are-failing-to-graduate-low-and-moderate-income-students.pdf. ⏎
- United States Census Bureau. (2019), Educational attainment in the United States: 2018. Retrieved from the United States Census Bureau’s website: https://www.census.gov/data/tables/2018/demo/education-attainment/cps-detailed-tables.html. ⏎
- Chellman, C. (2019, February). Phone interview with A.J. Roberson and K. Mugglestone. ⏎
- CUNY Matters. (2018), Keep on moving on. Retrieved from the City University of New York’s website: http://www1.cuny.edu/sites/matters/2018/02/16/keep-on-moving-on/. ⏎
- Chellman, C. (2019, February). Phone interview with A.J. Roberson and K. Mugglestone. ⏎
Additional Questions – How Campuses Can Act on Their Findings
- When do students drop out—and why? - The importance of understanding when and why students drop out cannot be understated, given that dropping out (especially with debt) is the worst possible outcome for a student. While research shows, on average, the highest rates of non-persistence occur between the first and second years of college, digging beneath those averages can show that different students are following different trends at different institutions (as is evident from Figure 2.3 above). Understanding these patterns is the key to the development of targeted interventions to prevent inequitable non-completion rates. For instance, Florida State University analyzed year-to-year attrition rates and found that students of color and low-income students drop out at high rates in subsequent years, instead of just the first year.24 By disaggregating their data and looking at longitudinal retention rates, they were able to identify and address some of the challenges faced by these students. To understand why students are leaving, institutions should survey students who leave or conduct interviews or focus groups with enrolled students to collect qualitative data on the barriers they face to progression.
-
What role do non-credit-bearing, developmental education courses play in influencing retention and completion, and how many students are impacted? - Our K-12 education system regularly fails to serve students adequately or equitably, resulting in approximately one-in-five undergraduate first-year students entering college with insufficient academic preparation and taking developmental education courses.25 These courses cost students additional time and money, delaying their entry into gateway courses, and reducing their chances of completion.2627 To examine the scale and impact of developmental education at your institution and to find ways to address these barriers, consider the following questions:
- How many students take non-credit-granting, developmental education courses, and how many developmental courses do they take?
- What interventions or reforms (e.g. corequisite developmental coursework) could support success for students who enter with lower levels of academic preparation?
- Which courses are the greatest barriers to credit completion ratios and why? - Which courses—and course sections—have high DFW rates (“DFW” rates represent the percentage of grades that are D, F, or W[ithdraw])? Are they high-enrollment courses? Are they concentrated among specific faculty members? Are students more likely to withdraw or earn a D or F when they do not reach the first-year credit completion milestone? Answers to these questions can help you diagnose specific barriers to credit completion and adjust faculty assignments or course distributions.
- What patterns do students show in selecting and changing majors or accumulating excess credits, and what impact do those patterns have on completion rates? – Understanding the different pathways students take toward completing their program is essential for understanding persistence and graduation gaps. When students change majors, courses that had previously been mandatory become electives, and students must complete an entirely new series of coursework. Some of those mandatory courses may be offered only once per year or may conflict with other required courses. For these reasons, there is evidence that students who determine their college roadmap earlier in their college career are more likely to persist and complete. While needs will vary across institutions, quality advising to help students select a good-fit major, careful course scheduling, degree maps, and guided pathways—fully planned academic majors with set course schedules from enrollment to completion—are all possible interventions that may help to promote completion at your institution.2829
- Are these patterns evident in long-term trends? – If there are identifiable patterns in retention and persistence at your institution, then it is possible that these patterns have existed for a long time. Investigating the long-term trends may shed light on the effectiveness of existing institutional policies, allowing better targeting of future interventions.
- The Education Trust. (2013), Replenishing opportunity in America: Florida State University. Retrieved from The Education Trust’s website: http://edtrust.org/wp-content/uploads/2013/10/2012_A2S_Case_Study_Florida_FINAL.pdf. ⏎
- 18.1 percent of first-year undergraduates in 2015-2016 (after graduating from high school in the previous year) took at least one remedial course in their first year. IHEP analysis of 2015-16 data from the National Postsecondary Student Aid Study (NPSAS:16) a product of the National Center for Education Statistics, U.S. Department of Education. Computation by NCES PowerStats Version 1.0 on June 14, 2019. Variables: REMETOOK, ELAPSE, and UGLVL1. Weight: WTA000. ⏎
- Bautsch, B. (2013), Reforming remedial education. Retrieved from the National Conference of State Legislatures website: http://www.ncsl.org/documents/educ/REMEDIALEDUCATION_2013.pdf. ⏎
- Jimenez, L., Sargrad, S., Morales, J., & Thompson, M. (2016), Remedial education: The cost of catching up. Retrieved from the Center for American Progress website: https://cdn.americanprogress.org/content/uploads/2016/09/29120402/CostOfCatchingUp2-report.pdf. ⏎
- Association for Public Land Grant Universities. (2017), Quest for student success. Retrieved from the Association for Public Land Grant Universities website: http://www.aplu.org/projects-and-initiatives/accountability-and-transparency/using-data-to-increase-student-success/APLU_WhitePaper_MTSU_B.pdf. ⏎
- Center for Community College Student Engagement. (2018), Show me the way: The power of advising in community colleges. Retrieved from the Center for Community College Student Engagement website: http://www.ccsse.org/nr2018/Show_Me_The_Way.pdf. ⏎
Cohort Analysis
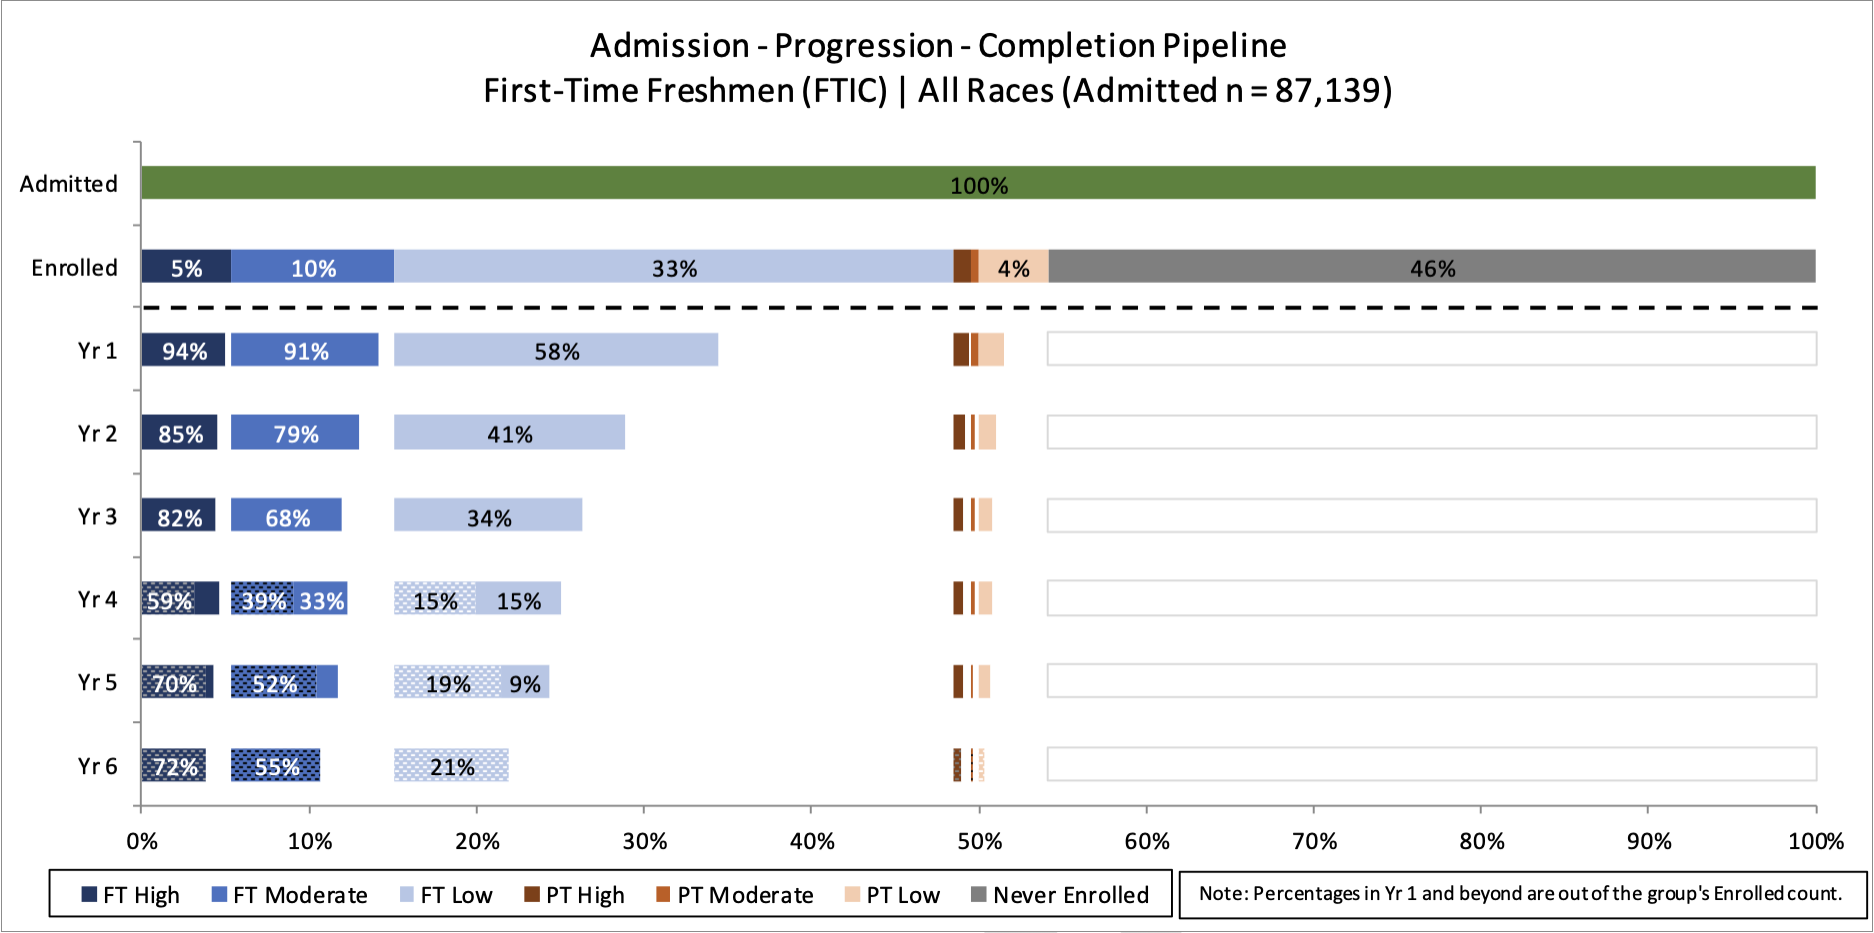
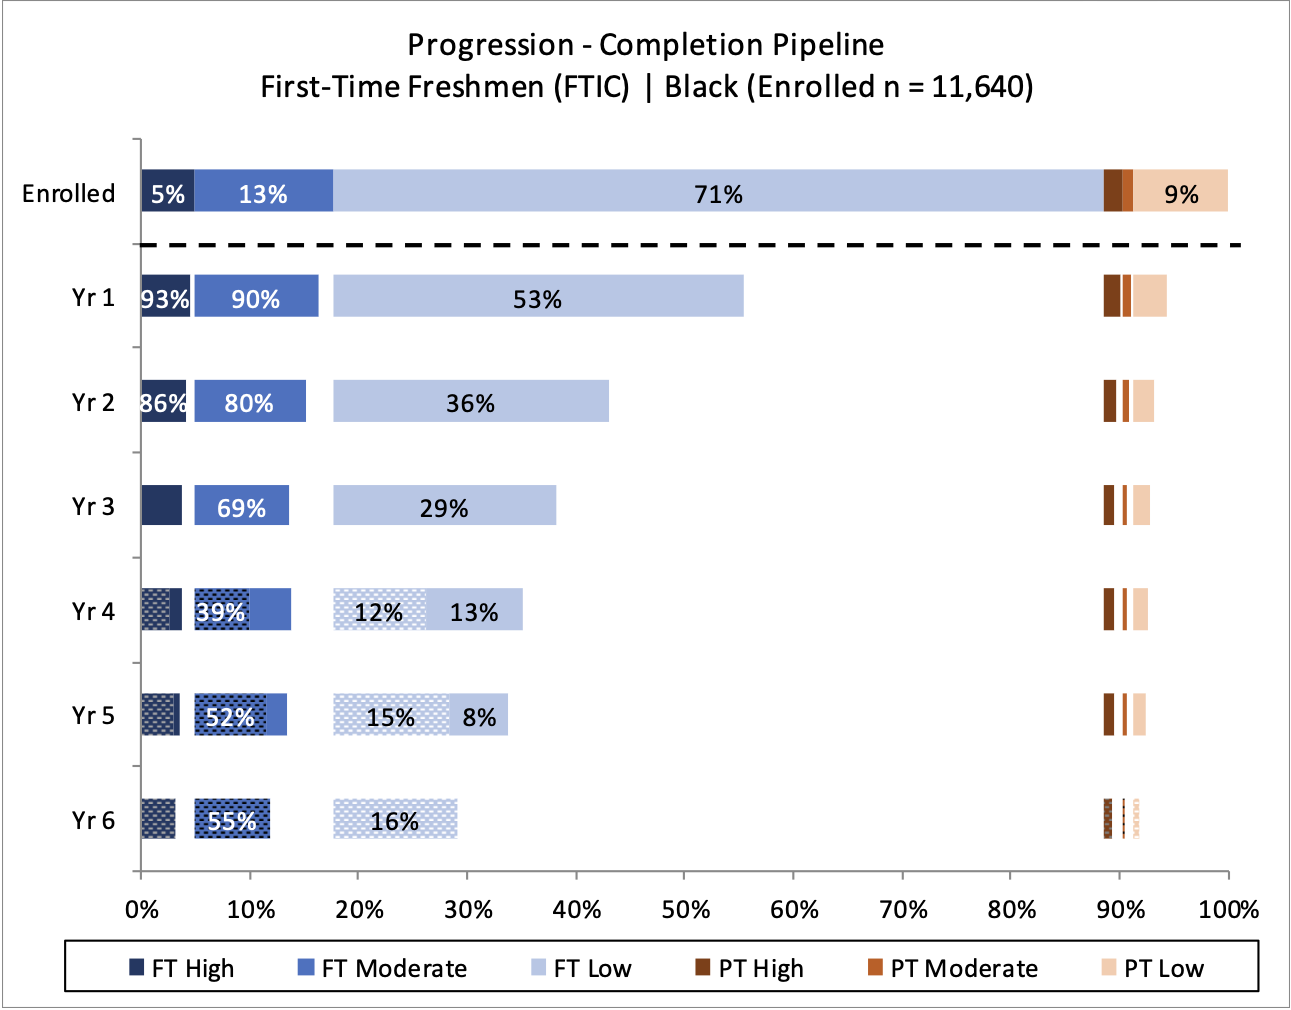
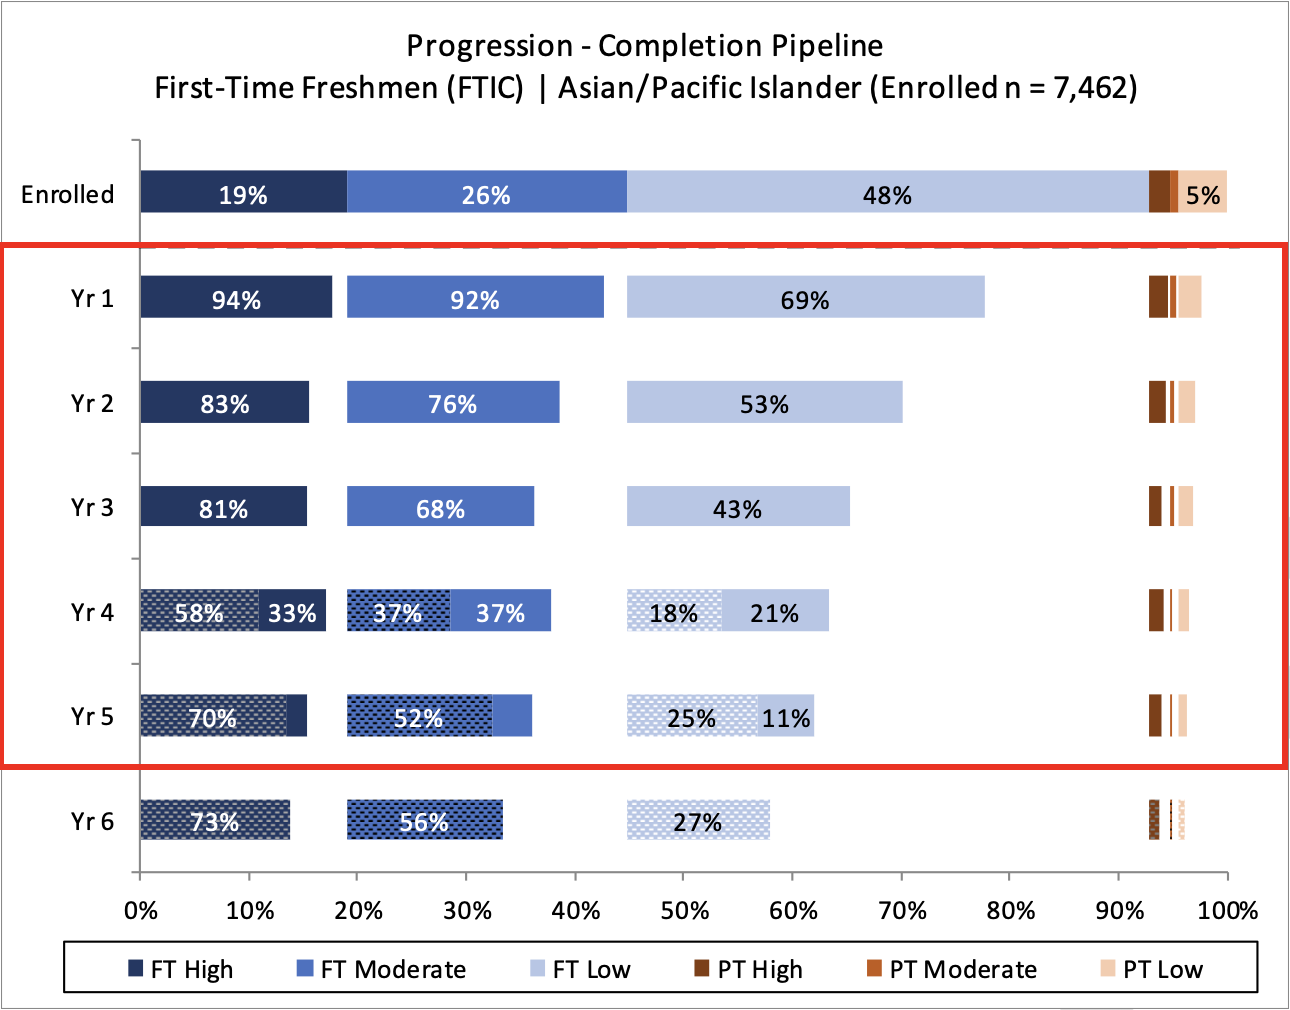
As shown below, retention and persistence comprise the bulk of the cohort analysis. In order to ensure that institutions are serving all students equitably, researchers should understand how different groups of students persist year over year, and the pipeline analysis helps to illuminate these patterns. If particular subgroups are failing to return at the same rate as their peers, the pipeline analysis should be able to help identify which points in college progression are the most hazardous for students and target their interventions accordingly. Take, for instance, in the pipeline progression analyses of first-time Black students and first-time Asian students (shown below). One can see marked inequities in enrollment and retention patterns. Black full-time students are far less likely than their Asian peers to enroll at moderate-to-high credit intensity. While retention and success rates among the students who do enroll at higher intensities are largely comparable, at low credit intensity, the retention rate and year-over-year attrition rates are substantially higher for Black students, especially after their first-year. Therefore, these cohort analyses suggest that efforts to increase and maintain higher credit intensity for Black students, especially during their first or second year, is a pathway to more equitable retention rates—and ultimately, completion rates.
Figure 2.4: Cohort Analysis and Details