|
Key Research Questions |
|
|
Underlying Metrics |
Net price: The average cost of attendance (COA) for an institution less all grant aid in a given year. Unmet need: The average net price for an institution less the average expected family contribution (EFC) in a given year. |
|
Disaggregates |
First tier: race/ethnicity, Pell Grant receipt, number of credits enrolled, income quintiles |
| For more detail on these underlying metrics, refer to pages 3.14 - 3.18 in the Metrics Framework. | |
College is one of the most expensive and important investment decisions that a student will make in their life. Ideally, the full cost of college should be manageable for any student through reasonable family contributions to college savings and a part-time, minimum wage job.1 However, for many students, institutions fail to meet this basic threshold.2 As a result, even though research shows that college pays off, students are (understandably) sensitive to pricing and affordability challenges.345 Student perceptions of how affordable particular institutions are can impact institution choice or enrollment intensity.6 As a result, low-income students are more likely to attend two-year community colleges, which regularly demonstrate lower success and completion rates. Finally, affordability challenges can affect a student’s ability to progress and complete.78
As might be expected, low-income students feel the brunt of high college prices. Nationally, 57 percent of Pell Grant recipients (compared to 27 percent of those who did not receive Pell) took out loans to pay for college.9 There are also racial equity considerations, as 51 percent of Black students (compared to 40 percent of White students) took on student loans in the 2015-2016 academic year, and racial wealth gaps place borrowers of color in a more precarious situation with regard to repaying their loans than White borrowers from families with greater average wealth.101112 Therefore, in order for institutions to maintain their role as engines of economic mobility and equity, they should prioritize their limited financial aid resources toward students from low-income backgrounds and students of color. As institutions consider financial aid and affordability for their students, institutions should ask questions such as:
- To what extent is the institution affordable for low-income students and students of color?
- Is there a threshold at which unmet need correlates with noncompletion?
By calculating commonly used metrics like net price and unmet need, disaggregated by income and race, institutions can explore which students are facing the greatest financial difficulty and determine to what extent this difficulty impacts their ability to persist and graduate. Then, institutions will have data as a foundation to make changes to the financial aid award processes to help those students who need financial assistance the most. The precise relationship between affordability and completion is unique to each institution and factors like socioeconomic status, state and institutional investment in need-based aid, and net price of the institution may impact it.
While other chapters of this Guidebook make use of systemwide data from CUNY, the institution-specific nature of financial aid data make the development of system-wide analyses difficult. Because of these challenges, we illustrate these cost metrics using nationally representative data for all first-time students at public four-year institutions, as derived from the Beginning Postsecondary Students Longitudinal Study (BPS:04/09). The template for this chapter, however, still functions in the same way as previous chapters and will produce a graphic when aggregate data are entered.
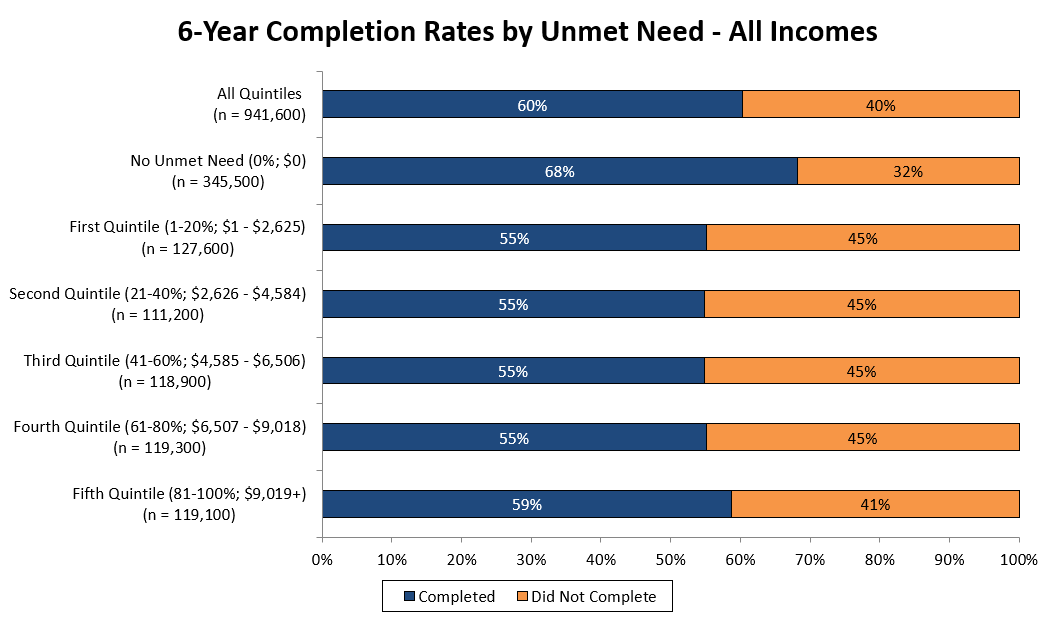
In Figure 4.1, below, a relationship exists between having no unmet need and completion. The first bar, as shown, represents all students with no unmet need. These students have a 13-percentage point higher 6-year completion rate than students with a low or moderate amount of unmet need. Indeed, evidence suggests that even a small amount of unmet need can derail a student’s progress to degree completion.13 Therefore, in order to ensure that an institution is equitably serving all of its students, it must address cost barriers and data show that meeting all unmet need would have dramatic positive effects.
Figure 4.1: 6-Year Completion Rates by Unmet Need After EFC (Quintile)14
- Lumina Foundation. (2015), A benchmark for making college affordable: The rule of 10. Retrieved from the Lumina Foundation’s website: https://www.luminafoundation.org/files/resources/affordability-benchmark-1.pdf. ⏎
- Poutré, A., Rorison, J., & Voight, M. (2017), Limited means, limited options: College remains unaffordable for many Americans. Retrieved from the Institute for Higher Education Policy’s website: http://www.ihep.org/limited-means-limited-options. ⏎
- The College Board. (2016), Education pays: The benefits of higher education for individuals and society. Retrieved from the College Board’s website: https://trends.collegeboard.org/sites/default/files/education-pays-2016-full-report.pdf. ⏎
- EAB. (2017), Why do students decline their dream schools? Retrieved from the EAB website: https://www.eab.com/Blogs/Enrollment/2017/03/Why-Do-Students-Decline-Their-Dream-Schools. ⏎
- Eckerson Peters, E., Roberson A.J., & Voight, M. (2019). The cost of opportunity: Student stories of college affordability. Retrieved from the Institute for Higher Education Policy website: http://www.ihep.org/research/publications/cost-opportunity-student-stories-college-affordability. ⏎
- Rorison, J., Voight, M., & Poutré, A. (2017) Exploring the role of affordability in first-year student access and persistence. In R. Feldman (Ed.), The first year of college: Research, theory, and practice on improving the student experience, and increasing retention (pp. 3-31). Cambridge: Cambridge University Press. ⏎
- Johnson, J., Rochkind, J., Ott, A.N., & DuPont, S. (2009), With their whole lives ahead of them. Retrieved from the Public Agenda website: https://www.publicagenda.org/files/theirwholelivesaheadofthem.pdf. ⏎
- Goldrick-Rab, S. (2016), Paying the price: College costs, financial aid, and the betrayal of the American dream. Chicago: University of Chicago Press. ⏎
- IHEP analysis of 2015-2016 data from the National Postsecondary Student Aid Study (NPSAS:16) a product of the National Center for Education Statistics, U.S. Department of Education. Computation by NCES PowerStats Version 1.0 on May 13, 2019. Variables: FEDPACK and TOTLOAN. Weight: WTA000. ⏎
- IHEP analysis of 2015-2016 data from the National Postsecondary Student Aid Study (NPSAS:16) a product of the National Center for Education Statistics, U.S. Department of Education. Computation by NCES PowerStats Version 1.0 on May 13, 2019. Variables: RACE and TOTLOAN. Weight: WTA000. ⏎
- Sullivan, L., Meschede, T., Dietrich, L, Shapiro, T., Traub, A, Ruetschlin, C. & Draut, T. (2015), The racial wealth gap: Why policy matters. (Demos: Washington, DC). Retrieved from the Demos website: https://www.demos.org/sites/default/files/publications/RacialWealthGap_1.pdf. ⏎
- Jones, J. (2017), The racial wealth gap: How African-Americans have been shortchanged out of the materials to build wealth. Retrieved from the Economic Policy Institute website: https://www.epi.org/blog/the-racial-wealth-gap-how-african-americans-have-been-shortchanged-out-of-the-materials-to-build-wealth/. ⏎
- Baum. S., McDemmond, M., & Jones. G. (2014). Institutional strategies for increasing affordability and success for low-income students in the regional public four-year sector: Tuition and financial aid. Retrieved from the HCM Strategists website at: http://hcmstrategists.com/maximizingresources/images/Tuition_Paper.pdf. ⏎
- In this analysis, a significant portion of the second unmet need quintile has $0 in unmet need. As a result, the first unmet need quintile, as visually represented, includes all individuals with $0 in unmet need, while the second unmet need quintile, as shown, only includes individuals with unmet need from $1 to $858. If it were possible to separate the students, it is likely that the second unmet need quintile would have an even higher average completion rate. ⏎
Considerations
Researchers may face several unique challenges when accessing and using financial aid data on some campuses, compared to other types of institutional data, data ownership being the primary obstacle. The financial aid office primarily holds data on financial aid, so utilization of these data will require cross-campus data sharing. As Zun Tang explains, “I think the biggest challenge for this project [is] analysis of the state financial aid, or of the financial pieces, because my office doesn’t have direct access to the financial aid data. Or, maybe we do have access to some of the data, but we don’t know what they mean.”15 It is essential that institutions encourage secure sharing and use of data across campus offices and use of common data dictionaries so that the people who need information to make decisions can access and understand it. Process and resource constraints within different offices on campus may be barriers to data access and it is essential that offices collaborate (and are given the latitude and resources to do so) to ensure that affordability and cost are analyzed alongside the phases of the pipeline.
Second, guidance from the U.S. Department of Education and the National Association of Student Financial Aid Administrators has raised questions about how institutions can share and use financial aid data for research and institutional improvement purposes. While recent public discourse and work from national partners has clarified some issues, the field may need a clarification in the next Higher Education Act reauthorization to ensure that institutions can utilize their data to make decisions.16
- Tang, Z. (2019, February). Phone interview with A.J. Roberson and K. Mugglestone. ⏎
- McPherson, P, & Keller, C. (2018), Letter on FAFA Data and PTAC guidance. Retrieved from the Association for Institutional Research website: https://www.airweb.org/docs/default-source/documents-for-pages/dpag/9-24_aplu-air_letter_on_fafsa_data_ptac_guidance.pdf?sfvrsn=28b4c193_2. ⏎
Additional Questions - How Campuses Can Act on Their Findings
- What percentage of the institution’s grant aid is targeted toward the lowest income students (i.e., lowest income quintile, Pell Grant recipients)? Toward students of color? How has this trend changed over time? – Nationally, the percentage of state aid distributed based on financial need has decreased since the early 1980s.17 This decline has occurred despite the fact that, on average, a dependent student from the lowest income quintile will need to finance an amount equivalent to 157 percent of their household income to pay one year’s net price at a four-year college. At the highest income quintile, students only need to spend 14 percent.18 Answering these questions about the distribution of institutional financial aid will determine how much your institution prioritizes aid to the students who need it most and will illustrate where priorities may need to change.
- How do students’ unmet need amounts change year-to-year, and what impact do those changes have on persistence and completion? – Many institutions have set eligibility periods for financial aid—often enough for an on-time completion—but then only offer limited aid for a fifth or sixth year (in a four-year program). Some institutions offer more aid in the first year than in subsequent years, leaving students with unexpectedly high bills when they return to school their second year. For instance, the University of Arizona’s Arizona Assurance grant offers up to $2,000 per year for four years and up to $7,300 for housing only for the first year.19 Changing the amount of aid a student receives each year can dramatically impact the costs that a student has to cover to complete, can make it harder to plan financially, and can force a student who is near completion to drop out if they exceed their aid eligibility. Examining the patterns of annual unmet need alongside persistence rates may help to target aid as students progress through the higher education system.
- What hidden costs are students facing? – While the standard Cost of Attendance calculation includes non-tuition costs like transportation and books, students face numerous other financial challenges that are not always measured. For instance, one in four college students is a parent, which potentially results in a need for child care during classes.20 Or, perhaps the car a student uses to get to the university unexpectedly needs a repair. These kinds of costs can entirely throw off a student’s budget, cause additional stress, and push a student to drop out of school. Given that half of undergraduate students report that they would struggle to cover an unexpected $2,000 expense,21 institutions should explore the types of financial hurdles students are facing outside of the standard cost of attendance.
- The College Board. (2019), Trends in student aid: 2018. Figure 23A. (New York: NY). Retrieved from The College Board website: https://trends.collegeboard.org/student-aid/figures-tables/need-based-and-non-need-based-state-grants-undergraduate-student-over-time. ⏎
- IHEP analysis of 2015-2016 data from the National Postsecondary Student Aid Study (NPSAS:16) a product of the National Center for Education Statistics, U.S. Department of Education. Computation by NCES PowerStats Version 1.0 on May 17, 2019. Variables: DEPINC, BUDGETAJ, TOTGRT. Weight: WTA000. ⏎
- The University of Arizona Office of Scholarships and Financial Aid (2019), 2019-2020 Arizona Assurance Program, information for current high school seniors. Retrieved from the University of Arizona Office of Scholarships and Financial Aid’s website: https://financialaid.arizona.edu/types-of-aid/arizona-assurance/high-school-seniors. ⏎
- Noll, E., Reichlin, L., & Gault, B. (2017), College students with children: National and regional profiles. Retrieved from the Institute for Women’s Policy Research website: https://iwpr.org/wp-content/uploads/2017/02/C451-5.pdf. ⏎
- Eckerson Peters, E., Roberson, A.J., & Voight, M. (2019). The cost of opportunity: Student stories of college affordability. Retrieved from the Institute for Higher Education Policy website at: http://www.ihep.org/sites/default/files/uploads/docs/pubs/ihep_student_voices_full_report_v6_web_pages.pdf. ⏎
Cohort Analysis
While the pipeline does not visualize cost, institutions should explore the financial aid and pricing factors that relate to access, progression, and completion patterns. At each stage of the cohort analysis, institutions should consider the unmet need of students who reach certain benchmarks and those who do not to examine the impact of pricing and financial aid policies. For instance:
- What is the unmet need among students who are accepted and enroll at your institution, compared with those who are accepted and do not enroll? More targeted financial aid practices could enhance yield among low-income students or students of color.
- How does unmet need compare across students who earn 24 or 30 credits in their first year and those who do not? Students with insufficient financial aid may reduce their course load to work more hours or to reduce tuition costs.
- How does unmet need vary across students who remain enrolled and those who stop out? High costs may be causing students to leave college before they complete their studies.