Each of the elements of a student’s college experience—from application and enrollment, through progression, to completion—combine to form a meta-analysis that we have referred to throughout this Guidebook as the ‘pipeline analysis.’ A visualized pipeline analysis shows institutions the full story of a cohort at a single glance. Each piece of the pipeline builds on the previous piece and provides an opportunity for institutions to follow students as they enroll, advance, and graduate, illustrating where students are most likely to succeed, stop, or drop out—and providing hints as to why. Therefore, the value of a pipeline analysis is its capacity to diagnose barriers at each step of the way and to provide additional guidance for interventions and solutions to address those barriers.
While individual pieces of the pipeline analysis have been highlighted throughout this Guidebook, this chapter will expand upon the usefulness of this tool. The example pipeline illustrated throughout this chapter has been constructed for first-time, full-time Hispanic students enrolled in the senior colleges of CUNY. Because the factors that influence completion will vary based on enrollment status and attendance intensity, we recommend developing pipeline analyses for each of the four cohorts recommended in the Metrics Framework (first-time, full-time; first-time, part-time; transfer full-time; transfer part-time) and for each level enrolled at the institution (bachelor’s-seeking, associate-seeking, certificate-seeking). The pipeline should also be disaggregated by race/ethnicity, age, and gender. As you build out your pipeline analysis and notice the patterns across a total cohort, consider essential questions from each of the prior chapters. This pipeline should provide you with further insights on the primary questions explored in all previous chapters.
Sidebox 5.1: The Postsecondary Data Partnership
If institutions or institutional systems want to scale up their data involvement, the Postsecondary Data Partnership (PDP) represents a possible next step for analysis. When institutions sign up for the PDP, they submit two data files, a cohort and a course file twice a year to the National Student Clearinghouse. This cohort data file uses metrics aligned with the Metrics Framework. In turn, the Clearinghouse cleans, validates, and aligns the data, providing each institution with a file that enables easier analysis. The Clearinghouse also includes interactive Tableau dashboards so that institutions can visualize performance indicators and equity gaps and download these visualizations for distribution. For more information on the PDP, click here. The PDP provides consistent calculations of the metrics across all types of institutions, including peer benchmarking.
The figure below provides a high-level overview of the Guidebook’s pipeline dashboard. The top-line graphic illustrates the complete pipeline. Students enter the pipeline by being admitted to your institution and then enrolling. Each subsequent level of the pipeline represents one year of progression, showing relevant statistics related to retention, and (starting in the fourth year) graduation. Each step of the pipeline also shows how students compare by key progression measures such as a gateway course completion and credit intensity (in the version shown, students are broken down by credit intensity). Below this top-line graphic is a table version of the same visualized data.
Figure 5.1: Cohort Analysis for First-Time Hispanic Students
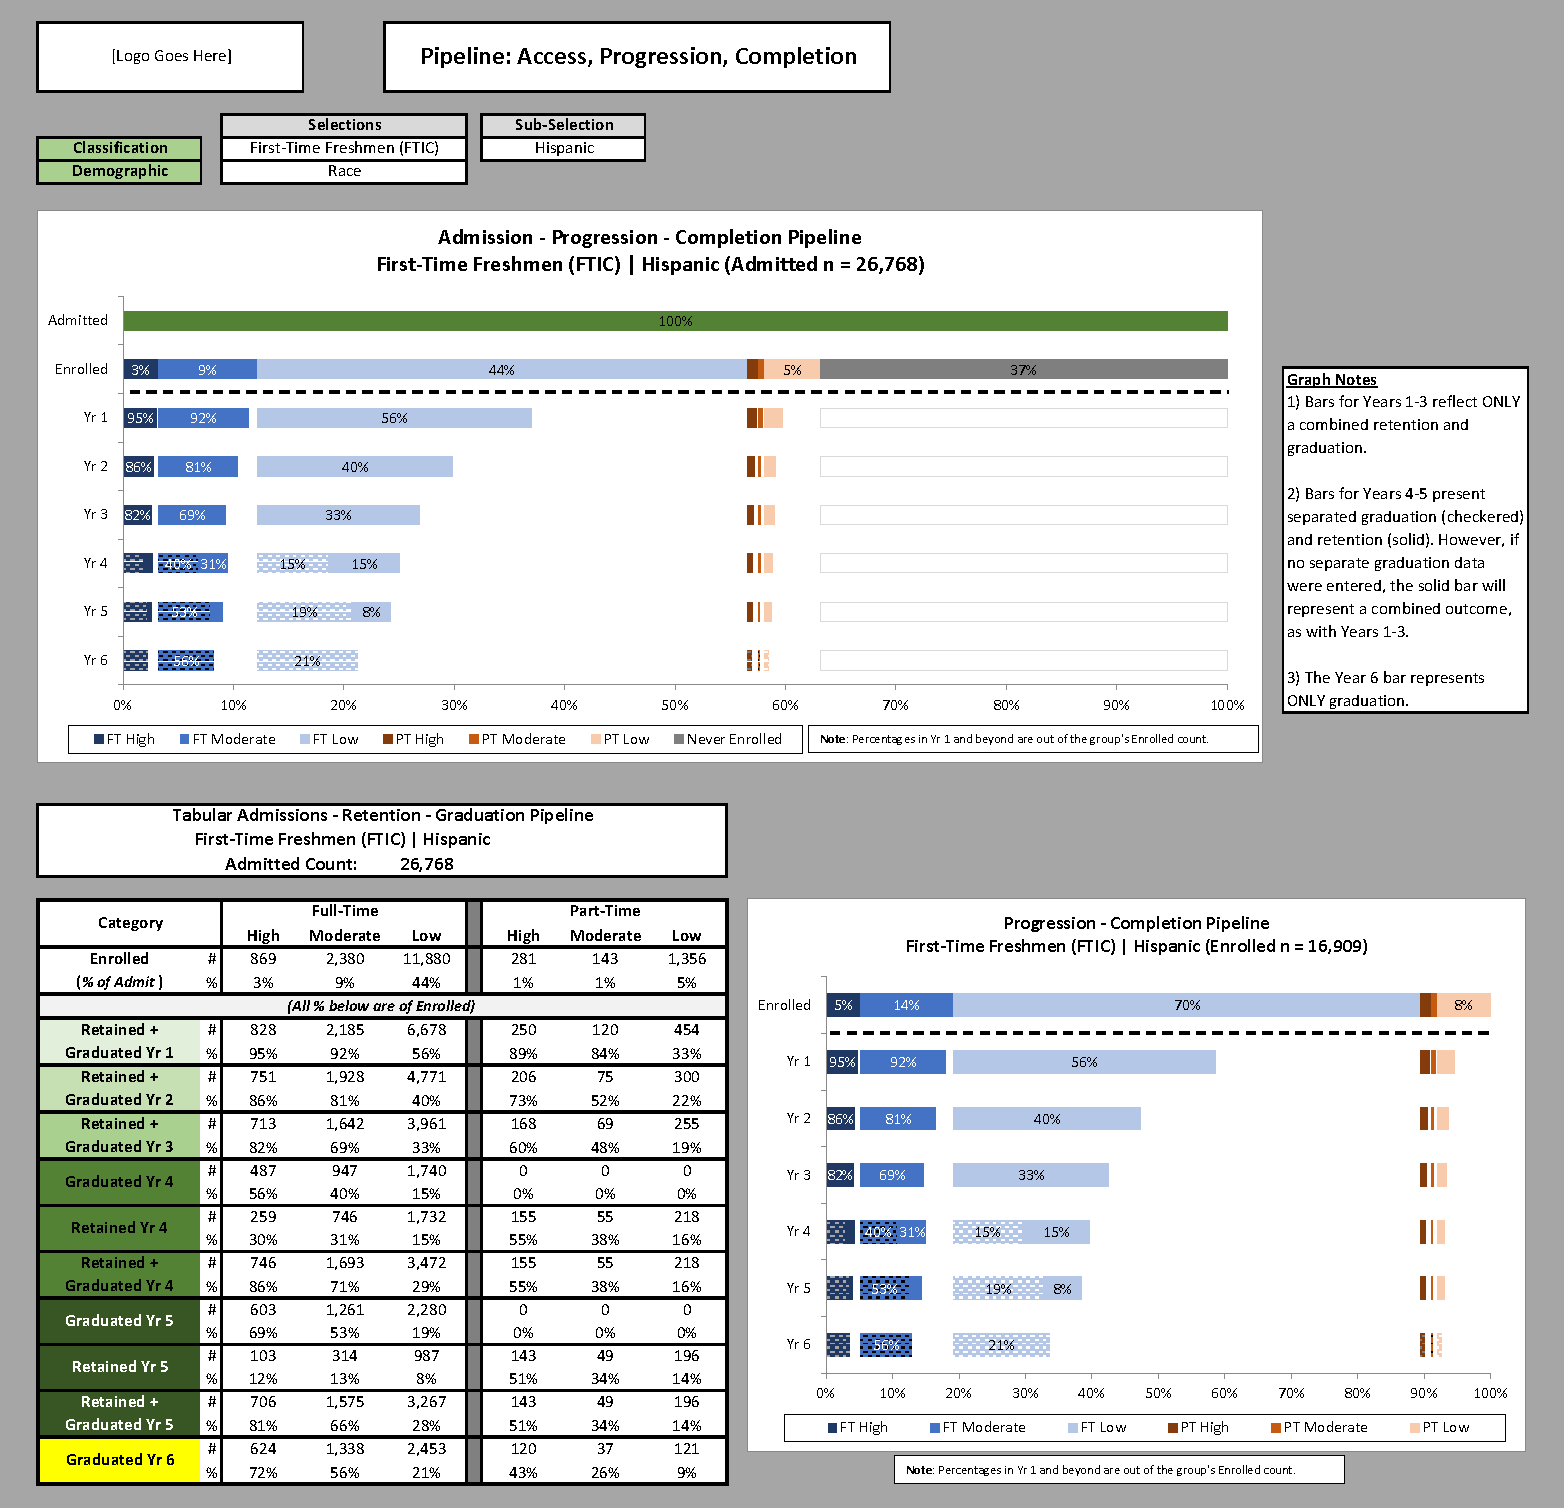
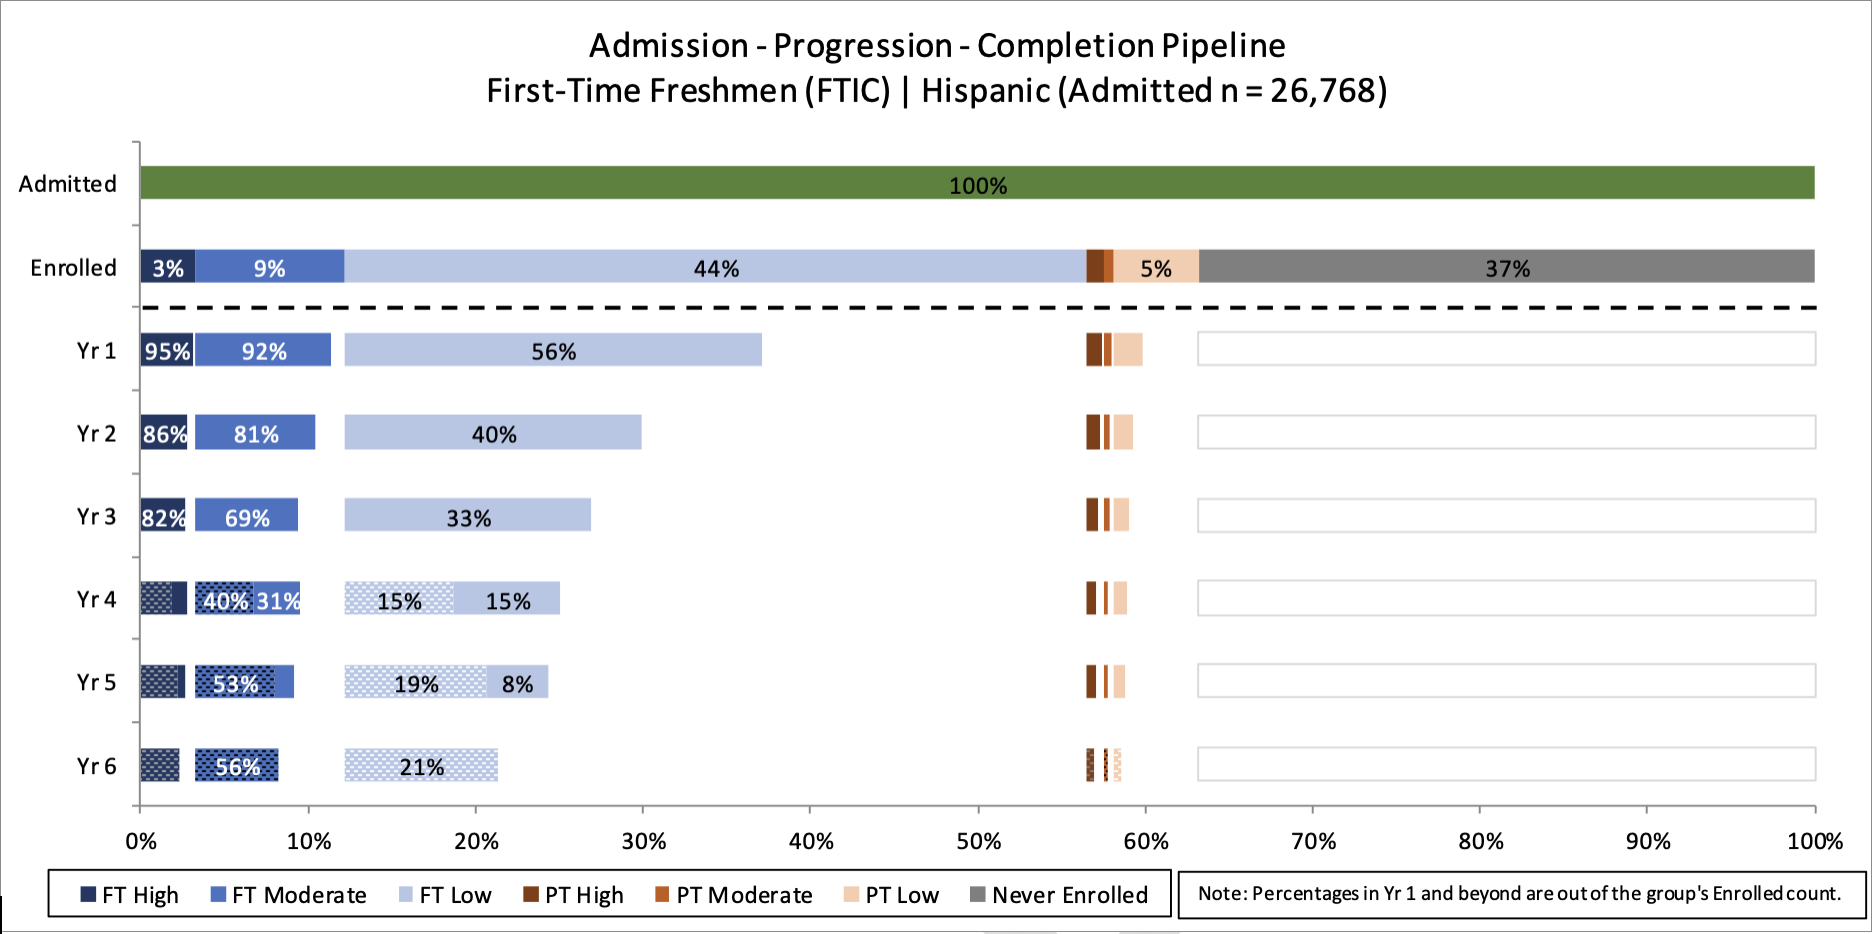
The topline graphic represents the best visual for analyzing access and first-year momentum (See: Chapter 1 – Access). The top two bars (above the dotted line) illustrate what percentage of accepted Hispanic students did not enroll or enrolled elsewhere as well as the initial credit intensity and part-time/full-time status of those who did enroll. These visualizations are useful for providing answers to the following primary questions related to access:
- Who is admitted to your institution? Who enrolls?
Most institutions, from the most selective to the least selective, have room to improve on equitable access and enrollment. While much of the public discourse around this topic focuses on the most selective institutions, White students make up a large percentage of students at ‘moderately selective’ four-year institutions as well.12
Building a diverse class requires a focus on both admissions and yield. Indeed, as shown above, failure to enroll represents the largest single cut to the potential student body in this example (37% of accepted first-time Freshman Hispanic students did not enroll). Estimates suggest 10 to 40 percent of accepted applicants do not enroll in their college or university in the fall, and low-income students and first-generation students are especially at risk of this ‘summer melt.’3 Institutions can use their data to take a hard look at who they are accepting, and of those students, who they need to focus efforts on in order to enroll a diverse class. - Who earns enough credits in their first year to have early momentum toward completion?
This first-year metric has significant impact on later progression metrics—including first-year retention—because this is when a student gets their first look at college coursework, structures, and bureaucracies.4 Students who take 15 credits or more in the first term are far more likely to complete their first year and return for a second.5 The top line analysis shown above verifies this finding, and also demonstrates that the vast majority of CUNY’s Hispanic first-time students enroll in fewer than 12 credits. This finding may indicate that the institution should explore ways to accelerate momentum for students who are only able to take 12 credits because of work or family obligations and to urge students to take 15 credits if at all possible.
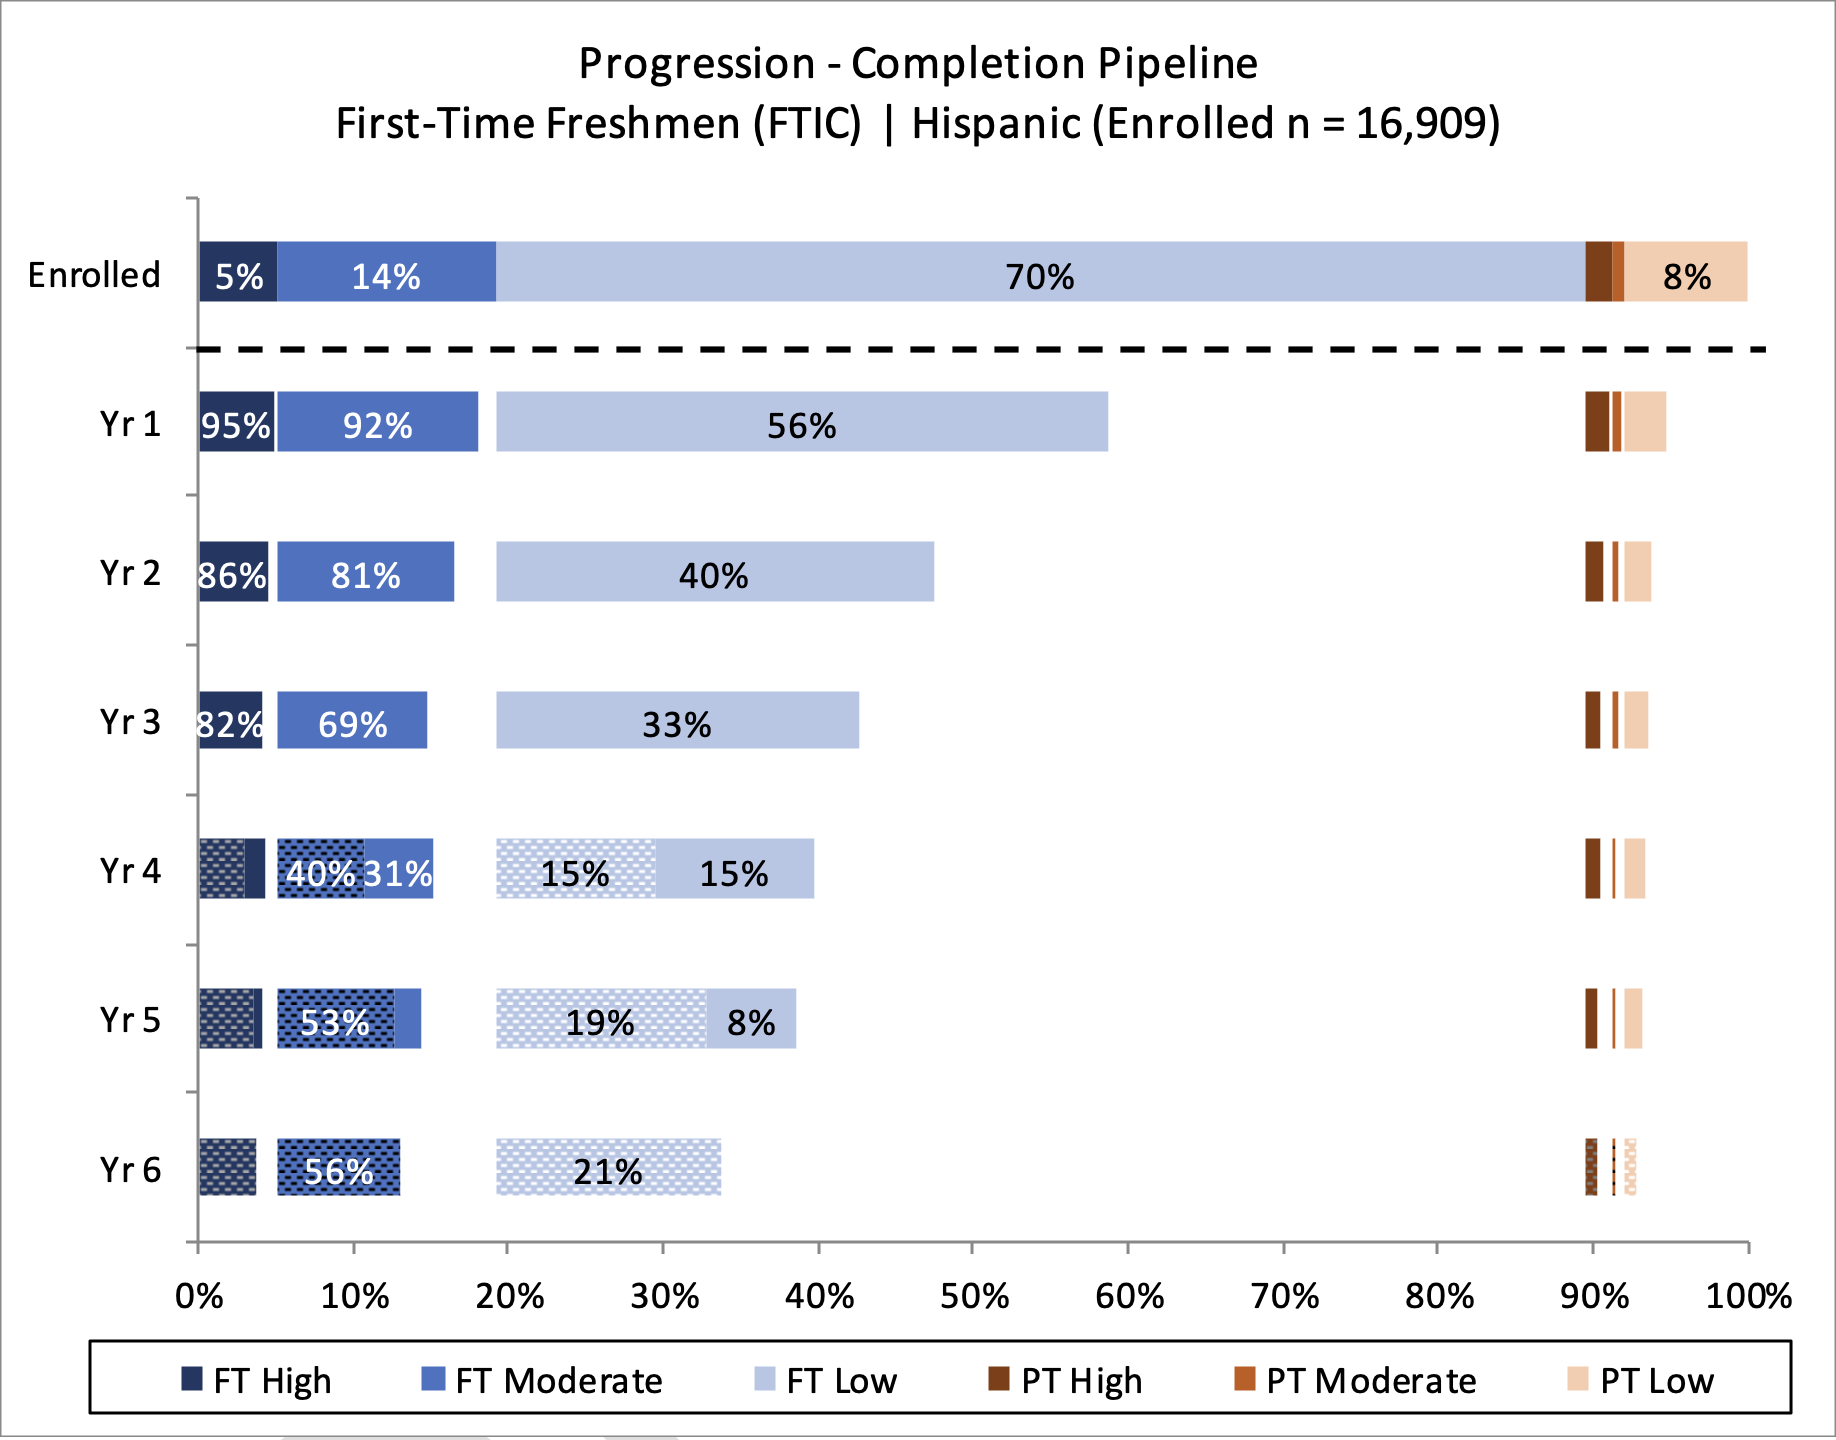
Next to the tabular data is a graphic that focuses solely on the progression and completion of the enrolled cohort in order to allow for a closer look at trends for students who do enroll. The data illustrated from year 1 to year 5 show the retention rate (shown in solid colors) of each student population. Years 4 and 5 also illustrate the percentage of that subset that has completed their degree (shown in a dotted pattern), alongside the retained population. Focusing first on the retained population allows for a longitudinal look at progression (see: Chapter 3). Therefore, this pipeline may be useful for answering the following primary research questions related to progression:
Figure 5.2: Cohort Analysis for First-Time Hispanic Students with Additional Completion Breakout


- Which students are meeting the key progression milestones and which students are not? What are the outcomes (retention and completion) of students who do and do not meet key progression milestones and benchmarks each year?
Results from these analyses will vary from institution to institution. In these examples, there is evidence that full-time students who complete 15 credits in their first semester (30 in the first year) are 19 percentage points more likely to complete their four-year degree than students who take only one course less (12 credits per semester).6 However, while the number of credit hours attempted is important, which courses are taken can also have meaningful effects on progression. As shown in chapter 2 (Figure 2.2), students who take and pass a foundational gateway course in their first semester are much more likely to persist to a second semester than those who do not take or pass one.7 Furthermore, a high credit success rate is indicative of higher academic performance, which is highly correlated with persistence. A student with a GPA of 3.0 or higher after their first semester is 127 times more likely to reenroll for their second semester than a student with a 2.0 GPA or higher.89
In the pipeline analysis shown above, it is clear that these patterns hold among first-time Hispanic students at CUNY (your institution’s results may be different). Year 1 (and beyond) retention rates are much higher for full-time students who took 12 or more credits, and this pattern persists over time. For instance, 82 percent of Hispanic students who enrolled with high credit intensity (15 or more credits) remained at the institution going into year 4, compared to only 33 percent of students who took fewer than 12 credits in their first year. Therefore, the vast majority of CUNY’s student attrition falls among students taking lighter course loads.
Researchers should examine results with a focus on what an institution can do to better serve students, and that requires meeting students where they are. A simple reaction to these findings might be that more students should take 15 credits, and certainly the institution should encourage students to take heavier course loads when possible. However, the institution should also recognize that students take lighter course loads for a variety of practical and necessary reasons. Some may need to work longer hours to afford tuition and living costs. Some may need to devote time to raising children or caring for ailing family members. To truly serve students, institutions must recognize and adapt to students’ needs. For example, a school could consider offering more short-term summer or winter sessions to help students accumulate credits quickly, or solicit student feedback on course scheduling to ensure they can access enough courses at convenient times to maximize their course load, or offer on-campus work or childcare opportunities to help students balance school with other obligations.
Figure 5.3: Completion Breakout for Cohort Analysis of First-Time Hispanic Students
Years 4 and 5 include completion rates alongside retention, and year 6 shows only completion (see Chapter 4). Comparing longitudinal completion data across student attendance patterns, enrollment intensities, and demographics in pipeline analyses can help to determine not only inequities in overall completion rates but also inequities in time-to-degree, a factor that can impact cost significantly for students. The pipeline analysis provides further context for each of the following primary questions related to completion:
- Who succeeds in college and what factors can help or hurt students?
Graduation is one key indicator of success, but for many institutions, especially 2-year colleges, the transfer of students into higher-level degree programs can and should be considered a success as well. The analysis of success rates presented in this Guidebook incorporates both of these means of success—graduation and transfer—into a big-picture, overarching metric. By analyzing the students who complete, transfer (downward, laterally, or upward), or do not complete, institutions are able to paint a full portrait of student success, making them better positioned to develop and refine programs that can close remaining gaps.
The pipeline analysis shown above illustrates that higher credit intensity drives higher completion rates. Furthermore, perhaps unsurprisingly, higher credit intensity leads to faster time-to-degree among these students. Of high credit intensity students who entered year 4, 65 percent completed their degree during that year. In contrast, only 50 percent of low credit intensity students entering year 4 graduated that year. - To what extent do completion gaps exist for key underrepresented students?
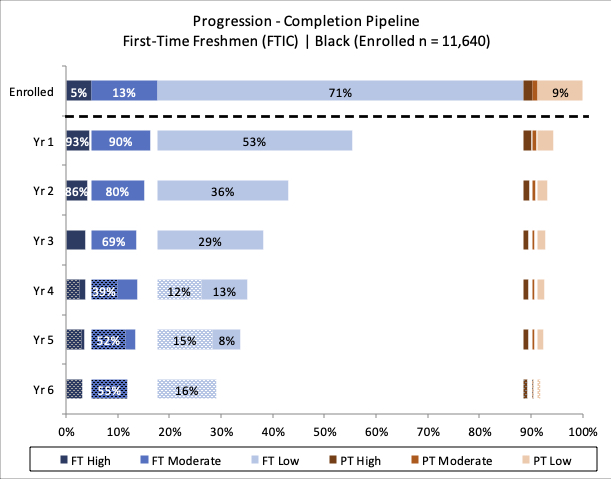
At many institutions, broad inequities characterize who completes and gets to reap the rewards of a college degree. For instance, nationally, Black students graduate with bachelor’s degrees at a rate nearly 40 percent lower than their White counterparts—and at the associate level, over 25 percent lower.10 Measuring institutional completion gaps is a first step toward increasing awareness about racial and socioeconomic inequities and providing educators and administrators with a baseline tool help narrow them.
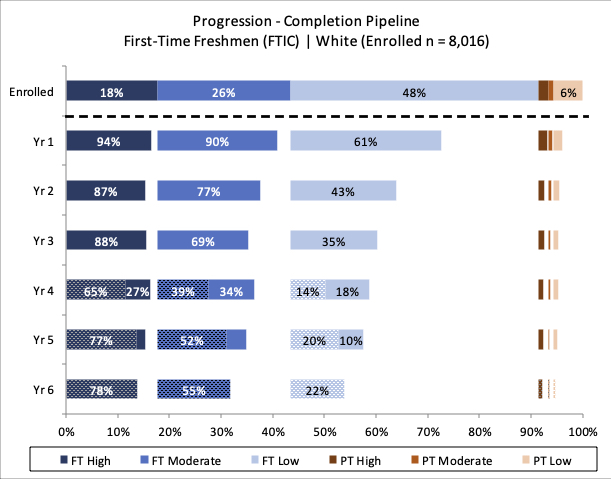
To consider this question, disaggregated pipeline analyses can be placed side by side for comparison. The example analyses shown below show marked differences in the credit intensity taken by Black and White students. Given the better, much higher completion rates seen among higher credit intensity students, this gap illustrates a need to find solutions to the barriers holding students of color from taking larger course loads throughout their college experience. Comparing trends like these allows researchers to diagnose clear inequities in completion and time-to-degree.
Figure 5.4: Completion Breakout for Cohort Analysis of First-Time Black and First-Time White Students
- Eckerson Peters, E. & Voight, M. (2018), Inequities persist: Access and completion gaps at public flagships in the Great Lakes region. Retrieved from the Institute for Higher Education Policy website: http://www.ihep.org/research/publications/inequities-persist-access-and-completion-gaps-public-flagships-great-lakes. ⏎
- IHEP analysis of 2015-16 data from the National Postsecondary Student Aid Study (NPSAS: 15-16), a product of the National Center for Education Statistics, U.S. Department of Education. Computation by NCES PowerStats Version 1.0 on June 19, 2019. Variables: SELECTV3 and RACE. Weight: WTA000. ⏎
- Castleman, B.L., Page, L.C., & Snowdon, A.L. (2013), Summer melt handbook: A guide to investigating and responding to summer melt. Retrieved from the Harvard University Center for Education Policy Research website: http://sdp.cepr.harvard.edu/files/cepr-sdp/files/sdp-summer-melt-handbook.pdf. ⏎
- Stinebrickner, T., & Stinebrickner, R. (2012), Learning about academic ability and the college dropout decision. Journal of Labor Economics. 30(4). 707-748. DOI: 10.1086/666525. ⏎
- Jenkins, D. & Bailey, T. (2017), Early momentum metrics: Why they matter for college improvement. Retrieved from the Community College Research Center website: https://ccrc.tc.columbia.edu/publications/early-momentum-metrics-college-improvement.html. ⏎
- Belfield, C., Jenkins, D., & Lahr, H. (2016). Momentum: The academic and economic value of a 15-credit first-semester course load for college students in Tennessee. Retrieved from the Community College Research Center website: https://ccrc.tc.columbia.edu/publications/momentum-15-credit-course-load.html. ⏎
- Flanders, G. (2017), The effect of gateway course completion on freshman college student retention. Journal of College Student Retention: Research, Theory & Practice. Vol. 19(1). 2-24. Retrieved from: https://journals.sagepub.com/doi/pdf/10.1177/1521025115611396. ⏎
- Ibid. ⏎
- Pascarella, E.T. & Terenzini, P.T. (1991), How College Affects Students. San Francisco, CA: Jossey-Bass. ⏎
- U.S. Department of Education, National Center for Education Statistics. (2018). Digest of education statistics 2018. Tables 326.10 & 326.20. 2014 cohort of first-time, full-time, degree/certificate seeking students. 150% regular time. Retrieved from the National Center for Educations Statistics website: https://nces.ed.gov/programs/digest/current_tables.asp. ⏎
Final Considerations
Outside of providing further insight into these primary research questions, the pipeline analysis should foster new questions as well. Any noticeable pattern in the pipeline should be extensively examined to look for an explanation and to seek solutions (e.g., student success interventions/programs, institutional policy or procedure change). Institutions should engage with students when crafting these explanations to avoid mistaken assumptions about student behavior and to better understand what institutional policies and practices are impacting the trends shown in the data. Qualitative research through conversations with students can add richness to the quantitative data and help point more directly toward solutions.