|
Key Research Questions |
Who is admitted to your institution? Who enrolls? Who earns enough credits in their first year to have early momentum toward completion? |
|
Underlying Metrics |
Enrollment: Twelve-month headcount that includes all undergraduate students who enroll at any point in the calendar year. Credit Accumulation: The percentage of students earning sufficient credits toward on-time completion in their first year (30 credits for full-time and 15 credits for part-time). |
|
Disaggregates |
First tier: academic preparation, race/ethnicity, economic status, gender Second tier: receipt of Title IV aid, unmet need, STEM program enrollment, age, race by gender, gender by STEM |
| For more detail on these underlying metrics, refer to page 3.2 in the Metrics Framework. | |
For students, access to college represents opportunity. Admission and enrollment are not the guarantee of a degree, but they are early steps toward earning one. Unfortunately, for many students, especially low-income students and students of color, access to a quality institution that will serve them well remains elusive. Every institution, from the most selective to the least selective, has room to improve on equitable access and enrollment. While much of the public discourse around this topic focuses on the most selective institutions, White students make up a large percentage of students at ‘moderately selective’ four-year institutions as well.12 Furthermore, even if an institution is accepting higher percentages of low-income students and students of color, they may not do enough to make sure they enroll. Estimates suggest 10 to 40 percent of accepted applicants do not enroll in a college or university in the fall, and low-income students and first-generation students are especially at risk of ‘summer melt.’3
As a result, it is clear that equity gaps persist and as the nation’s demographics shift, so should the programs and policies designed to foster access and enrollment in higher education.45678 In order for a college to effectively serve its students and close access gaps, it should understand which students are applying, are accepted, and are enrolling. Using these data, institutional leaders can assess, implement, and improve policies and programs designed to increase access and opportunity for all student populations.
The primary research question for measuring access is, “Who enrolls at your institution?” Institutions should take this simple question and break it down based on the key student characteristics from the Framework, including, but not limited to: academic preparation, race/ethnicity, economic status, and gender. In other words, how well is the institution doing at recruiting and enrolling a racially and socioeconomically diverse student body? Institutions also should compare admissions demographics to their local community, state, or the nation to benchmark their success at enrolling a student body that reflects their service area.
A secondary question for access is, “Who has early momentum at your institution?” This first-year metric has significant impact on later progression metrics—including first-year retention—because this is when a student gets their first look at college coursework, structures, and bureaucracies.9 Students who take 15 credits or more in the first term are far more likely to complete their first year and return to complete their degree.10 Therefore, this is a crossover metric that has implications for both access and progression, and again, we recommend analysis by both first- and second-tier disaggregates.
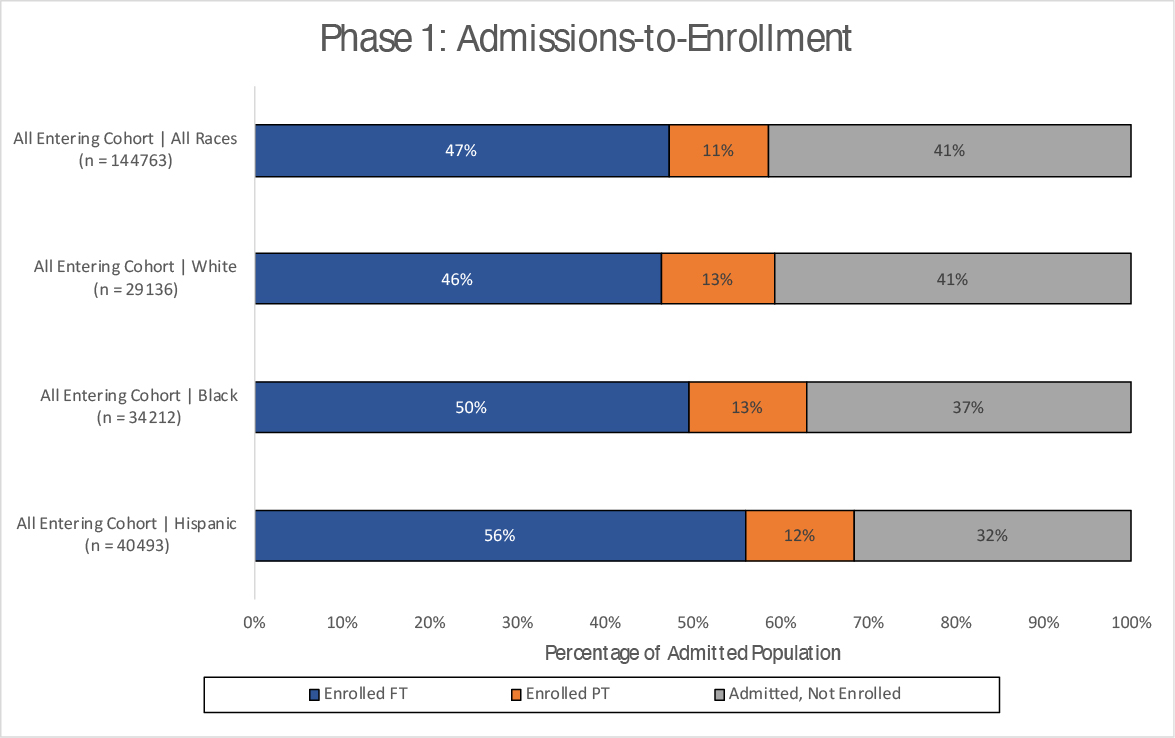
To diagnose inequities, institutions can then compare the demographics of their admitted students, enrolled students, and students who meet year-one credit-accumulation benchmarks, examining trends in yield and early momentum. To begin, Figure 1.1 (below) breaks down CUNY’s entire admitted cohort by race, illustrating a first point of attrition for students and whether enrolled students are enrolling part-time or full-time. Around 4 out of 10 accepted students choose to enroll elsewhere or not enroll at all, and a little over 1 in 10 students in this admitted cohort choose to attend CUNY but only part-time. Admitted Black and Hispanic students are more likely to enroll at CUNY than their White peers, but a larger share of enrolled White students attend CUNY part-time.
Figure 1.1: Loss of All Entering Students from Admissions to Enrollment by Race
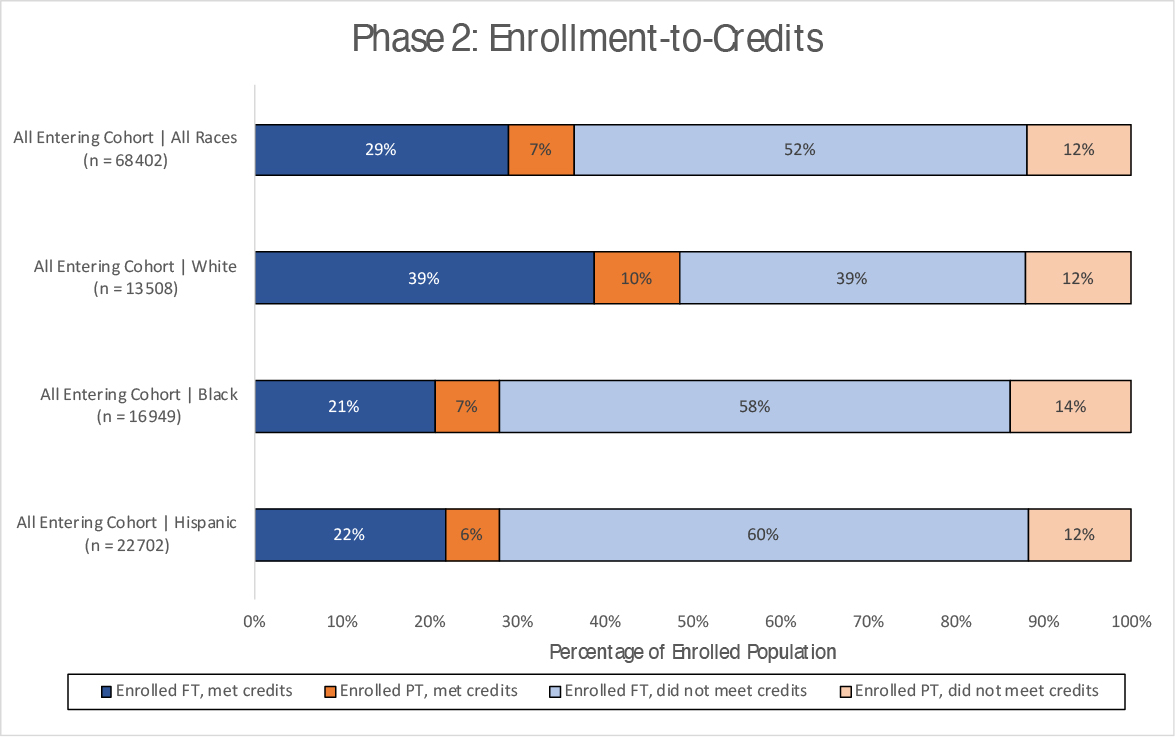
After identifying who is most likely to enroll (or not enroll), we know where our first student losses have occurred and who is more likely to be lost. This information – potentially allows us to target direct outreach to those students after admittance. Figure 1.2 (below) helps us to examine this enrolled population further. This graphic shows the percentage of these first-semester students who met credit thresholds (15 credit hours for part-time, and 30 credit hours for full-time). Most importantly, the darker colored sections illustrate the portion of students who successfully met credit thresholds, highlighting a significant racial gap between White students and their Black and Hispanic peers on this metric. Because course intensity is a predictor of continuing or stopping out, this gap may indicate a need for targeted interventions to encourage Black and Hispanic students to maintain a heavier course load, institutional engagement in order to promote completion of these courses, and creative institutional solutions to help students of color persist, even if they are unable to enroll in more credits because of work or family obligations. If these gaps are not addressed, racial gaps will likely grow as students progress in their programs.
Figure 1.2: Loss of All Entering Students from Enrollment to Meeting Credit Thresholds by Race
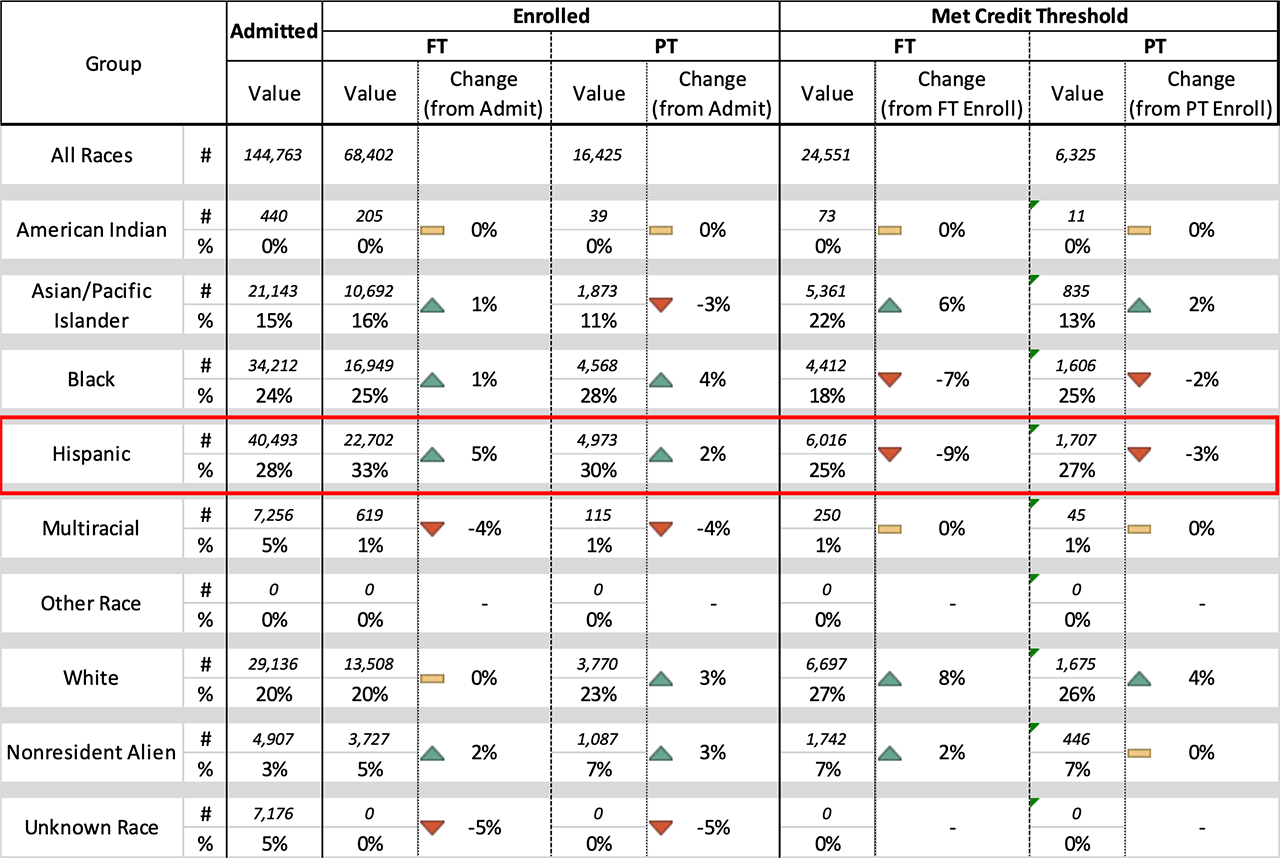
For a big picture overview of where students are underrepresented, Figure 1.3 (below) illustrates the diversity of the population reaching each phase of the access pipeline and highlights gains and losses in group representation at each step. This table is particularly useful for identifying which students are facing challenges in the access pipeline and where. For example, consider the Hispanic population. The first three data columns illustrate that the share of the full-time and part-time enrolled populations that identified as Hispanic are larger relative to the share of the admitted population that identified as Hispanic. Given the results illustrated in Figure 1.1, this finding was expected, because Figure 1.1 showed that a greater portion of the admitted Hispanic students enrolled in CUNY as compared to their peers. However, among the population of students who met credit thresholds, Hispanic representation is significantly lower, reflecting the relatively low percentage of enrolled Hispanic students who completed 15 or 30 credit hours in the semester. By identifying where student groups are over- or under-represented at each phase in the access pipeline, institutions should be able to refine and target their interventions and initiatives to close existing gaps in the pipeline.
Figure 1.3: Diversity of All Entering Students at Each Phase of the Access Pipeline, by Race
- Eckerson Peters, E. & Voight, M. (2018), Inequities persist: Access and completion gaps at public flagships in the Great Lakes region. Retrieved from the Institute for Higher Education Policy website: http://www.ihep.org/research/publications/inequities-persist-access-and-completion-gaps-public-flagships-great-lakes. ⏎
- IHEP analysis of 2015-16 data from the National Postsecondary Student Aid Study (NPSAS: 15-16), a product of the National Center for Education Statistics, U.S. Department of Education. Computation by NCES PowerStats Version 1.0 on June 19, 2019. Variables: SELECTV3 and RACE. Weight: WTA000. ⏎
- Castleman, B.L., Page, L.C., & Snowdon, A.L. (2013), Summer melt handbook: A guide to investigating and responding to summer melt. Retrieved from the Harvard University Center for Education Policy Research website: http://sdp.cepr.harvard.edu/files/cepr-sdp/files/sdp-summer-melt-handbook.pdf. ⏎
- Eckerson Peters, E. & Voight, M. (2018), Inequities persist: Access and completion gaps at public flagships in the Great Lakes region. Retrieved from the Institute for Higher Education Policy website: http://www.ihep.org/research/publications/inequities-persist-access-and-completion-gaps-public-flagships-great-lakes. ⏎
- Miller, A., Valle, K., & Engle, J. (2014), Access to attainment: An access agenda for 21st century college students. Retrieved from the Institute for Higher Education Policy website: http://www.ihep.org/research/publications/access-attainment-access-agenda-21st-century-college-students. ⏎
- Lynch, M., Engle, J., & Cruz, J.L. (2011), Priced out: How the wrong financial-aid policies hurt low-income students. Retrieved from The Education Trust website: https://edtrust.org/resource/priced-out-how-the-wrong-financial-aid-policies-hurt-low-income-students/. ⏎
- Haycock, K., Lynch, M., & Engle, J. (2010), Opportunity adrift: Our flagship universities are straying from their public mission. Retrieved from The Education Trust website: https://edtrust.org/wp-content/uploads/2013/10/Opportunity-Adrift_0.pdf ⏎
- Offenstein, J., Moore, C. & Shulock, N. (2010), Advancing by degrees: A framework for increasing college completion. Retrieved from The Education Trust website: https://edtrust.org/wp-content/uploads/2013/10/AdvbyDegrees_0.pdf. ⏎
- Stinebrickner, T., & Stinebrickner, R. (2012), Learning about academic ability and the college dropout decision. Journal of Labor Economics. 30(4). 707-748. DOI: 10.1086/666525. ⏎
- Jenkins, D. & Bailey, T. (2017), Early momentum metrics: Why they matter for college improvement. Retrieved from the Community College Research Center website: https://ccrc.tc.columbia.edu/publications/early-momentum-metrics-college-improvement.html. ⏎
Additional Questions – How Campuses Can Act on Their Findings
After identifying the access and enrollment patterns in your institution, it may become clear that further research is needed. For instance, after looking at Figure 2 above, CUNY’s researchers may decide that they should try to determine what is driving nearly 60 percent of admitted Black freshmen to choose to attend college elsewhere or to forgo college altogether. Is the college too expensive or failing to provide enough aid? Is transportation a challenge for these students? Which schools are these students selecting instead? It is important to consider what follow-up questions are necessary to better understand the equity implications of the admissions and enrollment policies. Some examples include:
- Who applies to your institution? – Institutions can only enroll the prospective students who they effectively recruit to apply. If an institution is seeking to increase the diversity of its enrolled class, a good place to start would be to determine if underrepresented students are not applying. If so, the institution should examine who is being targeted by institutional recruitment materials, as well as any structural application barriers (such as application fees) that may deter these students from applying. In fact, on average, low-income students apply to one college, compared to three applications among high-income students.11
- Why do you admit particular students? – Institutions have broad latitude on how to prioritize admissions to students. Some common admissions criteria drive structural inequities among admitted students. For instance, the consideration of demonstrated interest, early decision, legacy preference, or criminal history can have significant impacts on the demographics of your admitted student body.121314 Examining patterns among admitted or rejected students may help to determine which factors are the most impactful in your admissions process.
- Why do some admitted students not enroll? – A number of potential factors may explain why
certain students enroll and not others. Below, we suggest a few of them:
- What is the average unmet need of students who are admitted but do not enroll? – Rising costs are ensuring that college affordability is one of the most prominent factors in a student’s decision to enroll. Nearly 50 percent of students in 2016 said that financial assistance was a ‘very important’ factor in their decision to attend a particular institution.15 If students who do not enroll have high unmet need, it may indicate that the institution should review policies around student aid.
- Where do admitted students enroll, if not your institution? – Examining where admitted students do enroll can provide insight into existing policies because a direct comparison highlights institutional deficiencies. This may answer questions about institutional selectivity, reputation, affordability, program availability, campus climate, and proximity, among other factors. Surveys of admitted non-enrollees (perhaps administered when the student notifies your institution of their choice to not enroll) could be one way to explore this question.
- Is this pattern a long-term trend? – Investigating trends over time may shed light on the effectiveness of existing institutional policies, informing changes to those policies and allowing better targeting of future interventions. For instance, the University of Michigan recognized a long-standing shortage of low-income students applying and enrolling in the institution. However, with an intervention consisting of targeted recruitment materials designed to remind low-income students of Michigan’s tuition-free guarantee, the application rate and enrollment rate among low-income students who received the materials more than doubled relative to students who did not receive these materials.16 Recognizing the long-standing trend ensured a targeted solution.
- Institute for Higher Education Policy analysis of U.S. Department of Education, National Postsecondary Student Aid Study (NPSAS: 16) data. ⏎
- Eckerson Peters, E. & Voight, M. (2018), Inequities persist: Access and completion gaps at public flagships in the Great Lakes region. Retrieved from the Institute for Higher Education Policy website: http://www.ihep.org/research/publications/inequities-persist-access-and-completion-gaps-public-flagships-great-lakes. ⏎
- Kahlenberg, R. (2010), Affirmative action for the rich: Legacy preferences in college admissions. New York, NY: The Century Foundation. ⏎
- Park, J. & Eagan, K. (2011), Who goes early?: A multi-level analysis of enrolling via early action and early decision admissions. Teachers College Record. 113(11), 2345-2373. ⏎
- Eagan, K., Stolzenberg, E.B., Zimmerman, H.B., Aragon, M.C., Sayson, H.W., & Rios-Aguilar, C. (2017), The American freshman: national norms (Fall 2016). Retrieved from the Higher Education Research Institute website: https://www.heri.ucla.edu/monographs/TheAmericanFreshman2016.pdf. ⏎
- Dynarski, S., Libassi, C.J., Michelmore, K., & Owen, S. (2018), Closing the gap: The effect of a targeted, tuition-free promise on college choices of high achieving, low-income students. Retrieved from the National Bureau of Economic Research website: https://www.nber.org/papers/w25349. ⏎
Cohort Analysis
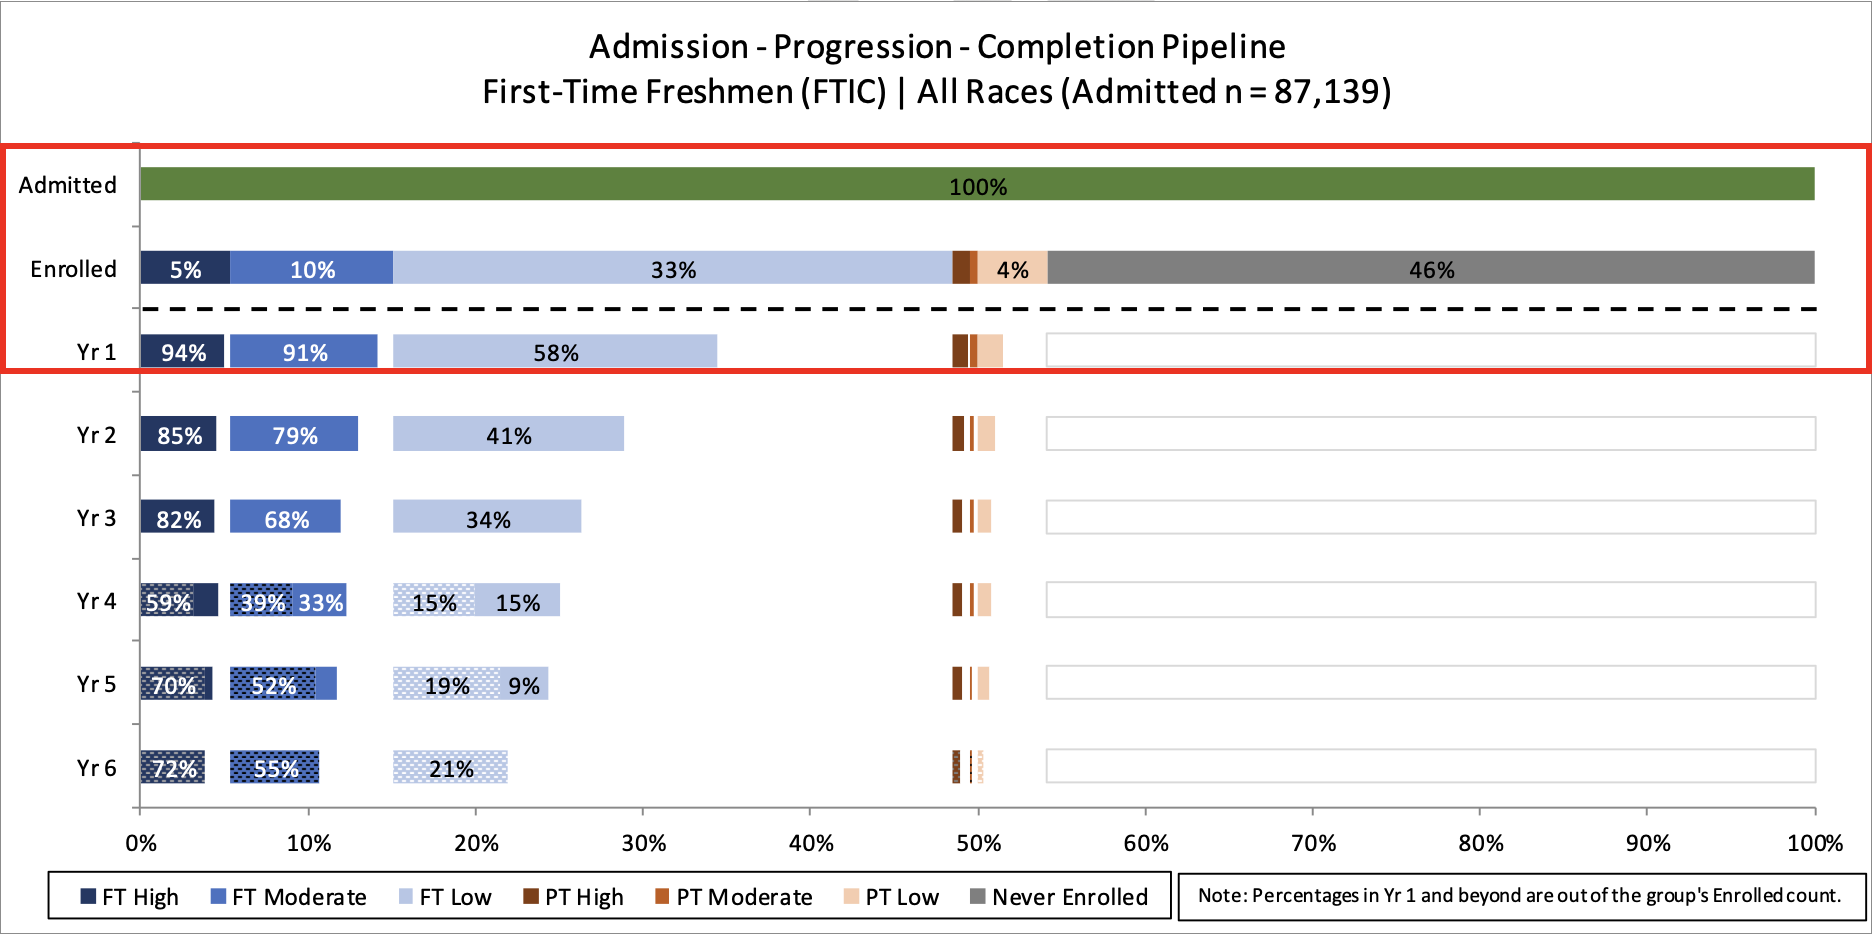
Access is the entry point to the college pipeline, which will be built out in more detail throughout this Guidebook. In the overview illustration below, access represents the top two bars above the dotted line. This portion of the analysis provides the baseline for understanding who is enrolling at the institution and at what intensity. Nearly half of all potential first-time freshmen choose not to attend this institution, but among those who do, only a small portion of enrolled students enter as part-time students. Institutions should use disaggregated data pipelines to investigate which students are enrolling and assess equity in enrollment, as well as equity in intensity. Without these considerations, any approach to closing equity gaps lacks a concrete basis. The following chapters provide guidance for institutions to examine which students are falling out of the pipeline and why. Those subsequent pipeline elements will be grounded in this enrollment baseline.
Figure 1.4: Cohort Overview for First-Time Students