|
Key Research Questions |
|
|
Underlying Metrics |
Graduation rate: The percentage of students in a cohort who earn the credential sought at their initial institution, up to 200% of program length. Transfer rate: The percentage of students in a cohort who transfer into longer programs at the initial or subsequent institution(s), up to 200% of program length. Success rate: The percentage of students in a cohort who either graduate with the credential initially sought at the initial institution or transfer to a longer program at the initial or subsequent institution(s), up to 200% of program length (Graduation rate + Transfer rate). Note: Each outcome rate should be captured at least at 100%, 150%, and 200% of program length. |
|
Disaggregates |
First tier: academic preparation, race/ethnicity, economic status, gender Second tier: receipt of Title IV aid, unmet need, STEM program enrollment, age, race by gender, gender by STEM |
| For more detail on these underlying metrics, refer to pages 3.10 - 3.13 in the Metrics Framework. | |
The importance of degree completion cannot be understated. The economic benefits a student gains from higher education grow substantially once the degree is in hand.1 Students who complete a college credential or degree not only have higher employment rates, higher earnings, and pay more taxes, but they are also less likely to smoke, more likely to exercise, and are more likely to be involved in their community.2 As a result, degree completion should be the ultimate goal of every student and every institution.
Unfortunately, broad inequities influence who completes and gets to reap the rewards of a college credential. For instance, nationally, Black undergraduate students graduate with bachelor’s degrees at a rate nearly 25 percentage points lower. At the associate level, the gap is over 8 percentage points lower, and it may be even larger if the graduation rate accounted for part-time and transfer students.3 Persistent completion gaps only serve to further exacerbate existing disparities.
Postsecondary institutions have the opportunity to make real impact on completion rates. Some institutions have narrowed or closed racial gaps in college completion, and they invariably have done so through a concerted focus on using data to inform change.45 By asking critical questions about student outcomes, disaggregating data, uncovering the inequities embedded in policies and practices, and implementing solutions, colleges and universities can increase completion rates and close completion gaps.
All institutions should be asking: Who succeeds in college and what factors can help or hurt students? To what extent do completion gaps exist for key underrepresented student subgroups? And, when answering these questions, institutions must count all students and all possible outcomes.
Institutions should calculate a graduation rate, transfer rate (particularly if transfer is a key mission of the institution), and a success rate for four cohorts of students: first-time, full-time; first-time, part-time; transfer-in, full-time; and transfer-in, part-time. While these proposed metrics go beyond the scope of typical federal reporting standards, each is essential in telling the full story of an institution’s success. First, by capturing the completion rates of all students, including those who transfer into the institution or attend part-time, institutions ensure that they are paying attention to the needs of all their students. Secondly, for many institutions, especially two-year colleges, the transfer of students into longer programs can and should be considered a success, regardless of whether or not the student earned a credential before transferring. Finally, the overall success rate incorporates both graduation and transfer into a big-picture, overarching success metric. This complete portrait of student success better positions institutions to develop and refine programs that can close gaps between race and income groups.
Sidebox 3.1: Why Lehman College Counts All Students
To highlight the importance of looking at the completion rates for all students, instead of just first-time, full-time students, consider Lehman College, where Jonathan Gagliardi estimates federal completion rate requirements would ignore up to 70 percent of new undergraduate students in a typical year.6 Jonathan expands upon the moral and practical imperative to measure success rates for everyone on campus: “We have a campus that is full of transfers. We have a campus full of folks who have stopped in and who have stopped out because the average age of an undergraduate student is 27. So, you've got students who are a little older, you've got students who really do reflect the new normal of undergraduate students.” Explaining further, he says, “[This] really does have implications for how we look at and what we measure in terms of success. Our transfer graduation rate is something that is important not just to us, but it's really important to CUNY given the fact that our community colleges and our four-year campuses have a hand-in-glove relationship, as these partnerships lead to the creation of buildable, stackable tiered credentials that really end up having a huge impact on our ability to deliver an affordable, high-quality education.”7
Because completion positions students to reap the full benefits of their postsecondary education, these metrics, disaggregated, represent an opportunity to illustrate a key component of institutional success to national, state, and institutional leadership. Leadership should care not only about maintaining a high rate of success overall but also about equitably distributing that success across groups. Furthermore, long-term trend evaluations show the progress (or a lack thereof) being made by an institution’s efforts.
Beyond measuring progress using disaggregated success rates, much of the diagnostic work of understanding low success rates and large racial and economic success gaps requires using the progression metrics in Chapter 2. An analysis like the one below links one of those progression metrics—credit accumulation—to completion in a way that unpacks the broader completion gaps and unearths avenues for improvement.
Figure 3.1: Completion Rates of All Entering Students by First-Year Credit Accumulation and Race
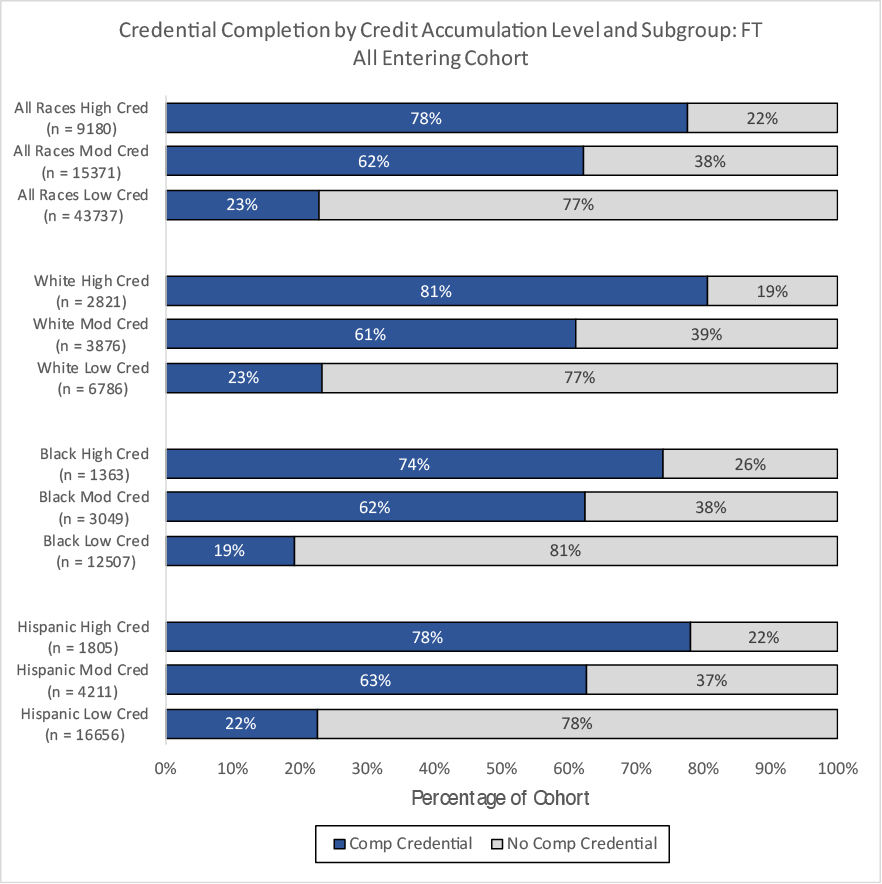
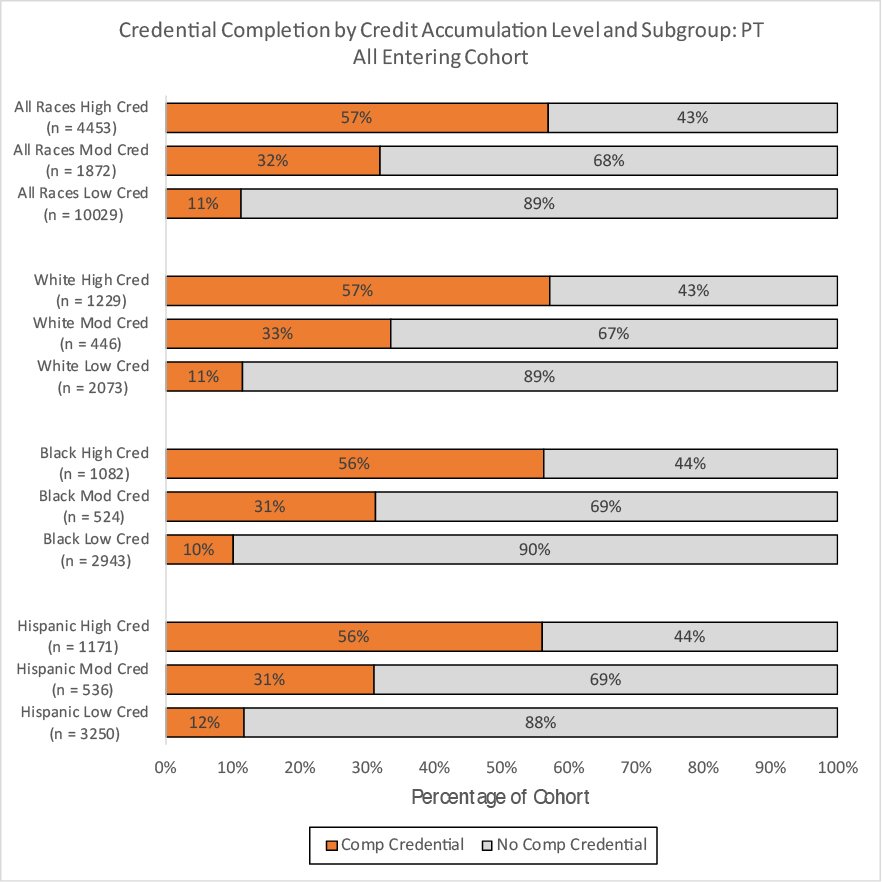
A clear pattern emerges from this analysis: As students take more credits, they are more likely to complete. A closer look shows several more detailed and useful findings. For instance, these analyses illustrate that meeting the 30-credit threshold results in the highest completion rates, but students experience a substantial boost in their likelihood of completion even if they only meet the 24-credit threshold. Interestingly, the impact of meeting higher credit thresholds is actually greater among part-time students than their full-time counterparts. As a result, these data suggest that part-time students could especially benefit from institutional efforts, such as creative course scheduling or enhanced financial aid policies, to increase credit accumulation. Finally, these statistics illustrate a somewhat equitable effect of 24 credit hours across racial and ethnic groups. However, among full-time students, the rise in completion rates among students completing 30 credit hours relative to students who only take 24 credit hours is about 8 percentage points higher for White students than their Black or Hispanic peers.
Figure 3.2 Completion Rates of All First-Time Students by Gateway Course Completion, Race, and Attendance Status
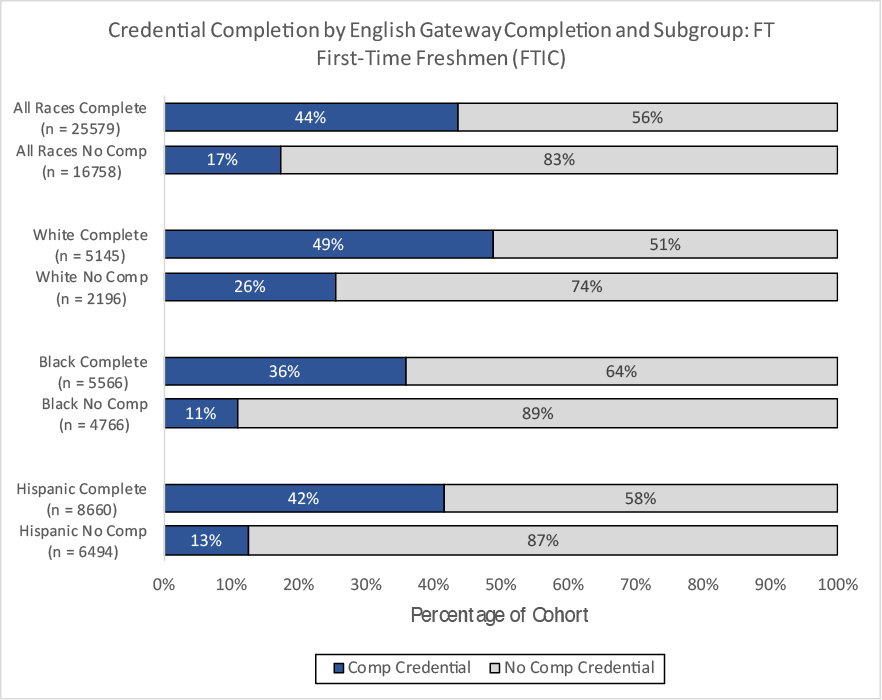
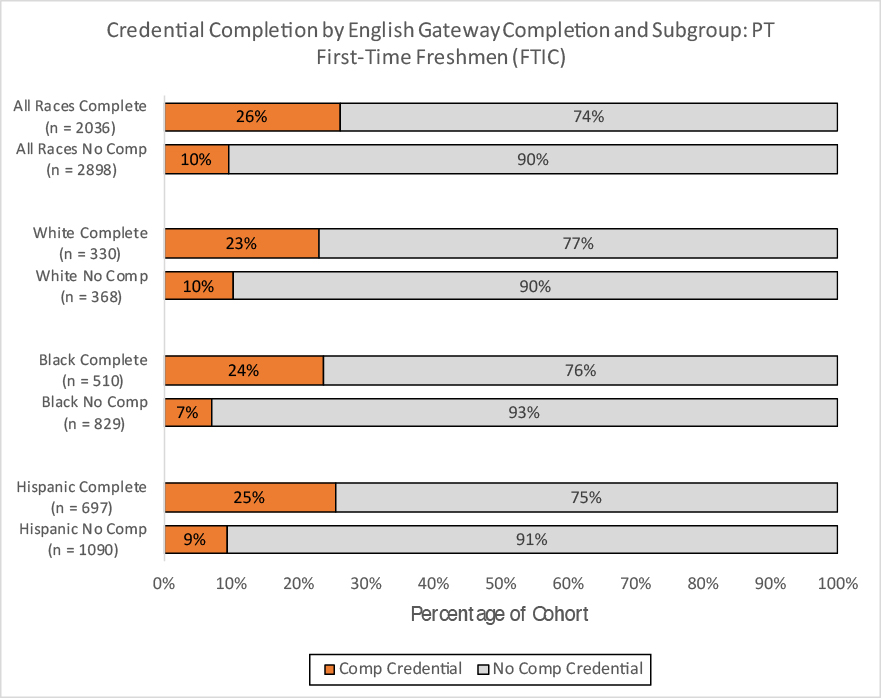
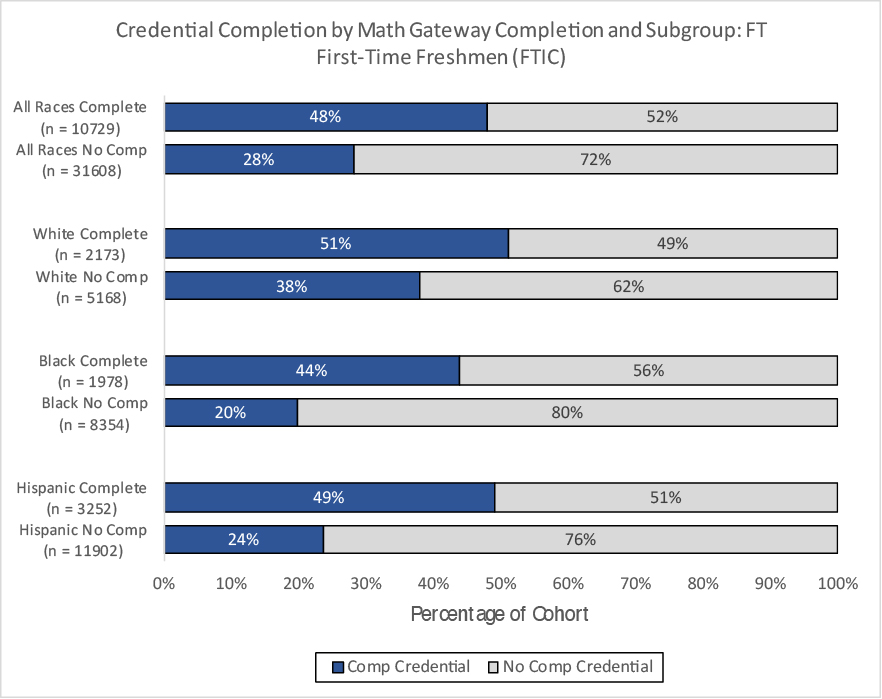
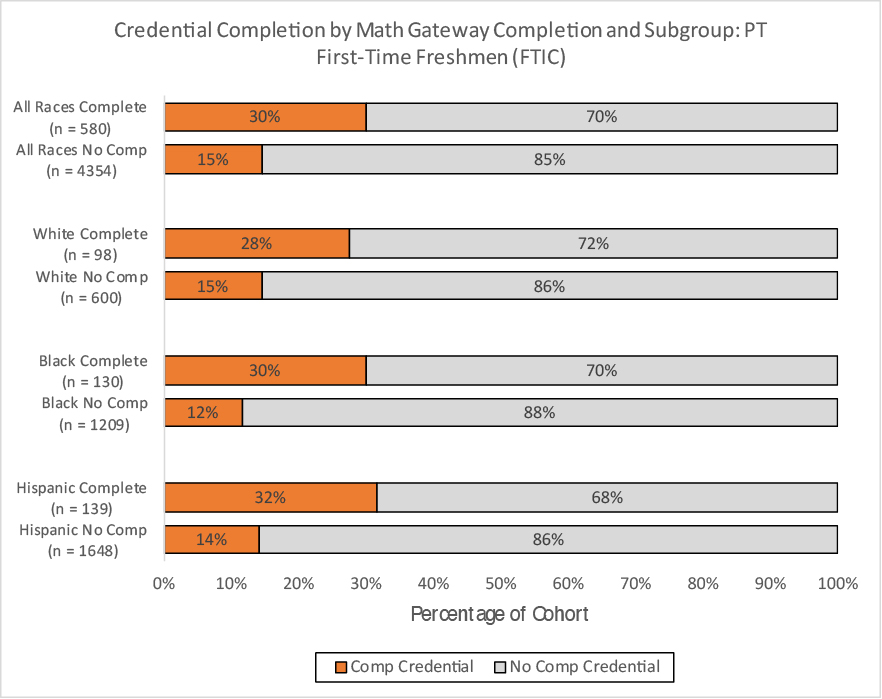
Figure 3.2: illustrates completion by gateway course completion among first-time freshmen. Most strikingly, completion rates either double or nearly double for students who complete either a Math or an English gateway course in their first year of college. More importantly, however, these data show that gateway course completion can help to close equity gaps. The difference in graduation rates between White students and students of color who did not complete a gateway course is significantly larger than the gaps among students who did. For instance, full-time White students who did not complete a math gateway course have a 38 percent completion rate, while Black students in the same situation only have a 20 percent completion rate—an equity gap of 18 percentage points. In contrast, the difference in completion rates between full-time White and Black students who did complete the Math gateway is only 7 percentage points (51 percent relative to 44 percent). As a result, this data would suggest that encouraging all students, but especially students of color, to take first-year gateway courses—and providing the support they need to complete those courses—is a powerful tool for closing completion gaps.
- Whitmore Schanzenbach, D., Bauer, L., & Breitwieser, A. (2017), Eight economic facts on higher education. Retrieved from the Brooking Institution website: https://www.brookings.edu/research/eight-economic-facts-on-higher-education/. ⏎
- Ma, J., Pender, M., & Welch, M. (2016), Education pays: The benefits of higher education for individuals and society. Retrieved from The College Board’s website: https://trends.collegeboard.org/sites/default/files/education-pays-2016-full-report.pdf. ⏎
- U.S. Department of Education, National Center for Education Statistics. (2018). Digest of education statistics 2018. Tables 326.10 & 326.20. 2014 cohort of first-time, full-time, degree/certificate seeking students. 150% regular time. Retrieved from the National Center for Education Statistics website: https://nces.ed.gov/programs/digest/current_tables.asp. ⏎
- The Education Trust, (2016), Using data to improve student outcomes: Learning from leading colleges. Retrieved from The Education Trust’s website: https://edtrust.org/wp-content/uploads/2014/09/HigherEdPG2_UsingDatatoImproveStudentOutcomes.pdf. ⏎
- Nichols, A.H. & Evans-Bell, D. (2017), A look at Black student success: Identifying top- and bottom-performing institutions. Retrieved from The Education Trust’s website: https://edtrust.org/wp-content/uploads/2014/09/A-Look-at-Black-Student-Success.pdf. ⏎
- Gagliardi, J. (2019, March). Phone interview with A.J. Roberson and K. Mugglestone. ⏎
- Gagliardi, J. (2019, March). Phone interview with A.J. Roberson and K. Mugglestone. ⏎
Additional Questions - How Campuses Can Act on Their Findings
- Do students have equitable access to high-impact practices? – While there is some debate about the cumulative effect of high-impact practices (HIPs), some evidence points to potential positive completion effects of practices such as first-year seminars, writing-intensive courses, collaborative assignments, study abroad, and student-faculty research.89 However, some of these opportunities, such as study abroad, require additional resources to participate, which may exclude low-income students. Determining whether all students have an opportunity to participate in these programs would be useful for improving equity on campus.
- Of the students who stop-out, who reenrolls? Who completes? – In the United States, approximately 1 in 5 adults have some college but no degree, meaning that they stopped out after completing some coursework.10 This represents an enormous pool of students who could reenroll and complete their degrees. Understanding which students are most likely to return to school after leaving enables targeted engagement and interventions tailored to these students’ unique circumstances.
- Of students still enrolled at 200% of program time or students who stop out, how many are near completion (e.g., fewer than 15 credits remaining)? – Students who are near completion but fail to complete represent one of the greatest tragedies in the higher education system. They have invested the vast majority of the resources and work to complete a degree but reap only a small portion of the potential reward. If your analyses find that your institution has a large number of these near-completers, it should consider developing a “degree reclamation” program by communicating with and implementing solutions to reenroll these students and help them across the finish line.10
- Why are students transferring? Are there institutional barriers to students completing at your institution? – There are good and bad reasons for high transfer rates, and the only way to understand the reality for your institution’s outgoing transfer students is to ask why they are leaving. It is possible that they leave to transfer for a higher degree (e.g. transferring from community college to a bachelor’s degree program). This is a positive transfer outcome. On the other hand, if students are transferring due to dissatisfaction or because of institutional barriers to completion (e.g., poor academic supports, poor advising, high costs), it is important to determine what the reasons are so that they can be addressed.
- How long does it take transfer students to complete their degrees? How many credits do students lose upon transferring in? Do completion rates for transfer students vary by the number of credits the students bring into the institution? – Transfer students generally bring some course credit with them, but on average, students who transfer from a community college to a public four-year institution lose 22 percent of previously earned credits.12 Institutions should use data to examine the ramifications of their credit acceptance policies and consider the unique supports that their transfer students may need.
- What non-academic circumstances affect our students and their ability to complete? – Every institution serves a unique student body with unique needs. Determining what those needs are and meeting them can be the key to increasing completion rates. For instance, CUNY serves a student body that is older, is more likely to have children, and lives in an expensive urban environment. Recognizing this, they implemented CUNY ASAP, a guarantee that provides a comprehensive array of supports to meet these needs head on, leading to higher completion rates for ASAP recipients.
- Are these non-completion patterns evident in long-term trends? – If there are identifiable patterns in non-completion (i.e., completion rate gaps between racial/ethnic groups), then it is possible that these patterns have existed for a long time. Investigating the long-term trends may shed light on the effectiveness of existing institutional policies, allowing better targeting of future interventions.
- Kuh, G.D. (2008), High-impact educational practices: What they are, who has access to them, and why they matter. Association of American Colleges and Universities: Washington DC. ⏎
- Findley, A. & McNair, T. (2013), Assessing underserved students’ engagement in high impact practices. Retrieved from the Association of American Colleges & Universities website: https://www.aacu.org/sites/default/files/files/assessinghips/AssessingHIPS_TGGrantReport.pdf. ⏎
- Wheatle, K., Taylor, J., Bragg, D., & Ajinkya, J. (2017), The potential of degree reclamation: A path to reclaiming the nation’s unrecognized students and degrees. Retrieved from the Institute for Higher Education Policy’s website: https://degreeswhendue.com/wp-content/uploads/2018/09/Wheatle-Taylor-Bragg-Ajinkya-2017.pdf. ⏎
- Ibid. ⏎
- Government Accountability Office. (2017), Students need more information to help reduce challenges in transferring college credits. Retrieved from the Government Accountability Office website: http://www.gao.gov/assets/690/686530.pdf. ⏎
After Completion – Post-College Outcomes
While post-college outcomes are not represented in the pipeline, both students and institutions gain enormous value from information on how students fare in the workforce after completion. Students are making one of the most important, expensive investments of their life, coupled with taxpayer investment, so it’s important to measure the return on that investment, for both the individual and society. Institutions can use these post-college outcomes, such as median earnings, employment rates, and debt-to-earnings ratios, to measure the effectiveness of their own programs, as well as their alignment with workforce demands.
Regrettably, with the Higher Education Opportunity Act of 2008, the federal government banned the U.S. Department of Education’s own data agencies from collecting the data necessary to calculate these workforce outcomes comprehensively at the national level.13 In the absence of federal action, a number of states and institutions have attempted to compile these data on their own. These data are valuable, yet incomplete.
The challenge for most institutions looking to measure post-college outcomes is that it is costly, time-consuming, and regularly requires building extensive relationships with other departments outside of higher education. Some institutions have used survey data to capture information on students after graduation, but this approach is highly burdensome and unreliable.14 Furthermore, this kind of survey data is duplicative with information that is typically already produced by state agencies.
Most institutions simply do not have the capacity to collect additional post-graduation data on students, and thus must rely on state-level workforce commissions and labor departments. Even if the data is made available, institutions need to consider additional expenditures on privacy and security considerations – ensuring that employment, earnings, loan, and tax data is all confidential and secure. However, if an institution is able to expend the effort, the results can be rewarding.
The State Council of Higher Education for Virginia (SCHEV), for instance, has developed the Virginia Longitudinal Data System (VLDS), a collaboration of state agencies designed to allow for the analysis of education and workforce data in a secure environment.15 In this system, deidentified data is matched across systems to allow for longitudinal study of post-college outcomes, while ensuring no single agency holds the full dataset. Lehman College is another institution that invests the resources, pulling data from New York’s Department of Labor to look at employment rates and incomes of Lehman graduates. Jonathan Gagliardi explains:
We're excited because what we're seeing is that a Lehman education really does have a transformative effect for our students who have worked hard to earn their degree. It's a ladder for upward mobility. It provides folks with an opportunity to move into the middle class and represents a huge growth in wages and an expansion of opportunity, particularly with our graduate programs, which ultimately provide a high quality of life and just a happy life for the people who end up coming here.16
Unfortunately, the problem with matching students to in-state Labor Departments is that students who leave the state are unable to be captured, and this represents a significant portion of students. One estimate suggests that 16 percent of young adults (aged 22-24) with bachelor’s degrees moved between states in the last year.17 To address this transient population, when the University of Texas system developed SeekUT, they not only linked records from the Texas Workforce Commission but also developed a partnership with the U.S. Census Bureau to capture former students living and working outside of Texas’s boundaries.18
Ultimately, measuring post-college outcomes allows institutions to help students reap the return on investment that they seek. When graduates of a program are failing to find work, or finding work with low pay, an institution should look inward to determine why. Is the institution’s reputation in that field of study falling short among employers? Are professors and lecturers inadequately conveying the material? Are course materials out of date? Are graduates not passing a key licensure exam? Is there insufficient labor market demand for a particular field of study? Has the institution counseled students about the most appropriate internship pathways and career development opportunities to make them attractive candidates to employers? These kinds of questions can be spurred by a review of program-level economic outcomes, and ultimately, these internal audits can help an institution better serve its students. In the end, the approaches taken by the institutions above may be productive but require resources and effort that are unrealistic for most institutions.
- Higher Education Opportunity Act, Public Law 110-315, 110th Congress, (2008). ⏎
- Zinn, R. (2016), Classroom to career: Leveraging employment data to measure labor market outcomes. Retrieved from the Institute for Higher Education Policy’s website: http://www.ihep.org/sites/default/files/uploads/postsecdata/docs/resources/leveraging_employment_data_0.pdf ⏎
- Virginia Longitudinal Data System. (2019), About VLDS. Retrieved from the Virginia Longitudinal Data System website: https://vlds.virginia.gov/about-vlds. ⏎
- Gagliardi, J. (2019, March). Phone interview with A.J. Roberson and K. Mugglestone. ⏎
- Kelchen, R. & Webber, D.A. (2018). Examining the interstate mobility of recent college graduates. Educational Researcher. 47(3). Accessible at https://journals.sagepub.com/doi/abs/10.3102/0013189X17753124. ⏎
- The University of Texas System. (2019), SeekUT. (Austin, TX). Retrieved from: https://seekut.utsystem.edu/ ⏎
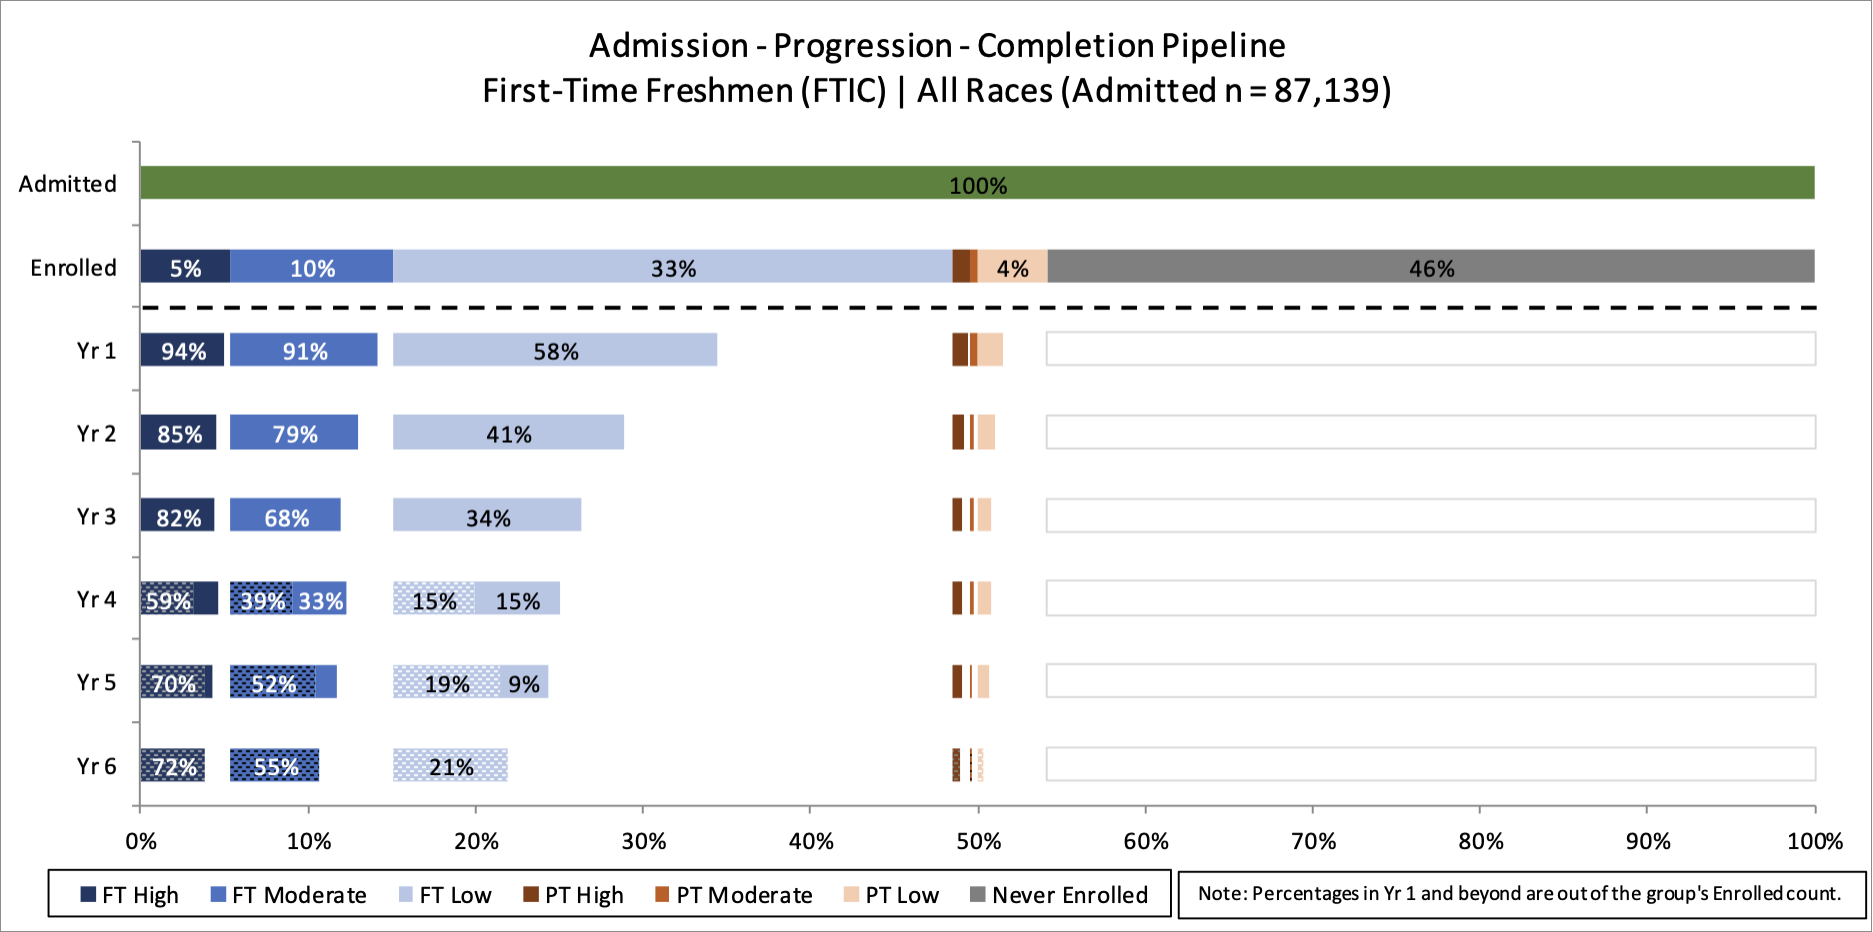
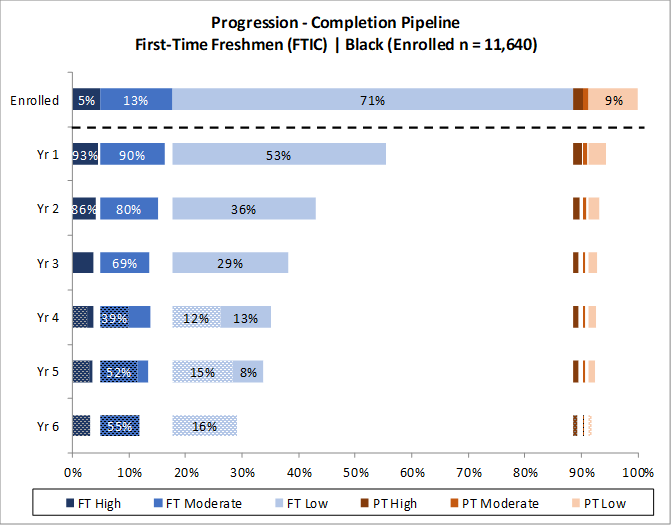
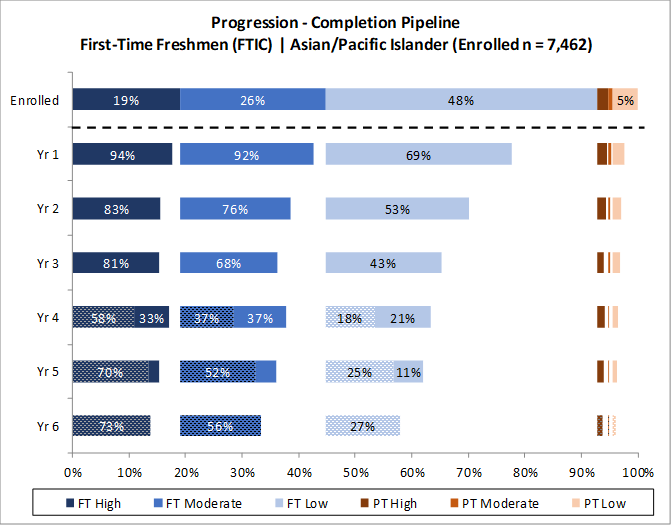
Cohort Analysis
In the completion component of the cohort analysis, we focus separately on the students who complete and those who do not in order to try to understand the factors that led to these outcomes. By disaggregating this analysis for different student groups, like Pell Grant recipients, students of color, and students who have or have not met college readiness thresholds, institutions can see where in the college pipeline different types of students are facing the greatest barriers and can work to address institutional policies that are creating or exacerbating these barriers by offering interventions to provide needed institutional support. Consider the same cohort comparisons as illustrated in Chapter 2, comparing the college pipeline of the 2011 cohort of first-time Black and Asian students (below). In particular, this pipeline analysis illustrates that Black students who take lower numbers of credits per semester have a much lower completion rate (illustrated by the “dotted” texture) than their Asian peers at years 4, 5, or 6. Meanwhile, their completion rates among higher credit intensity enrollees are equitable. Such an analysis again indicates that institutions interested in closing completion gaps should investigate what challenges are holding back Black students from enrolling at higher credit intensity rates and should target interventions to address these barriers.
Figure 3.3: Cohort Analysis and Details